2023 SpaceHACK in Review
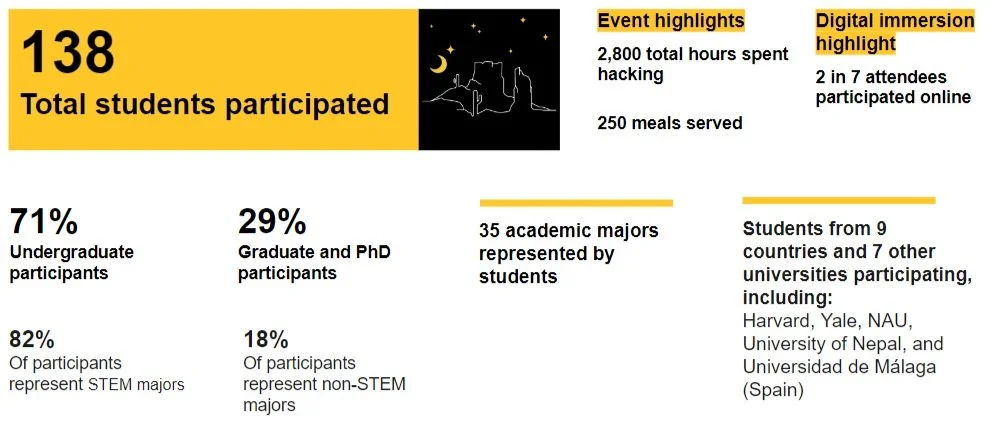
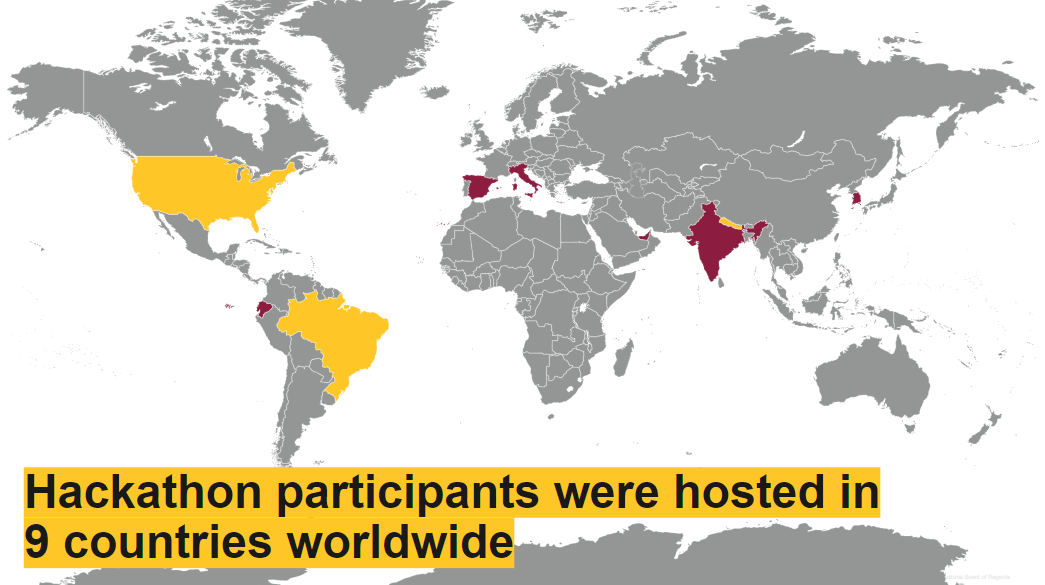
In March 2023, 138 students from 9 countries around the world came together to hack satellite data for the UN Sustainable Development Goals in the first ever SpaceHACK for Sustainability
SpaceHACK 2023 by the numbers
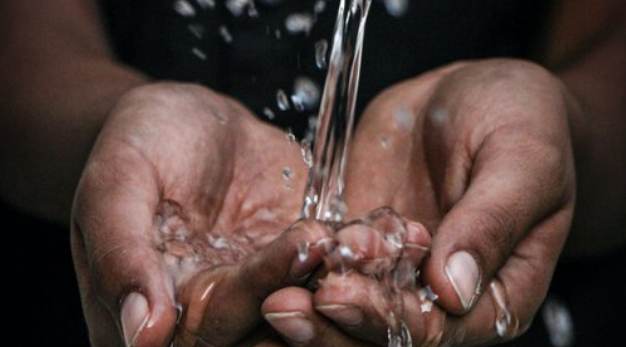
Sustainable Groundwater Usage
Nepal
If groundwater levels can be accurately measured using satellite data, this would provide the opportunity for enacting public policy around the increasingly scarce resource of groundwater.
2023 Tracks
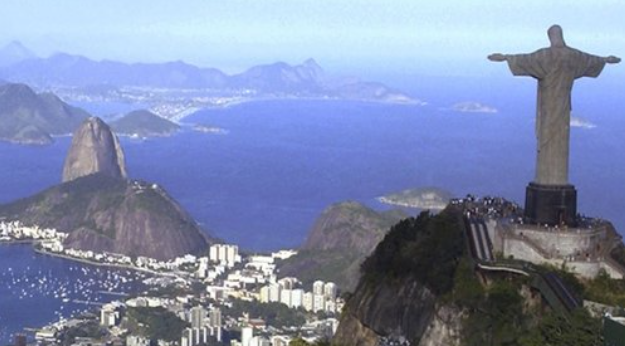
Climate Impacts on Favelas
Brazil
How might Climate Change be disproportionately impacting favelas in Brazil’s largest cities and how through remote sensing might we may be able to better alter and protect the region's most marginalized?

Wildfire Risk and Social Disparity
Global
Can we better understand whether social inequities that often push poor and marginalized communities to certain areas are linked to greater wildfire risk of loss of life and property in regions of higher wildfire risk?
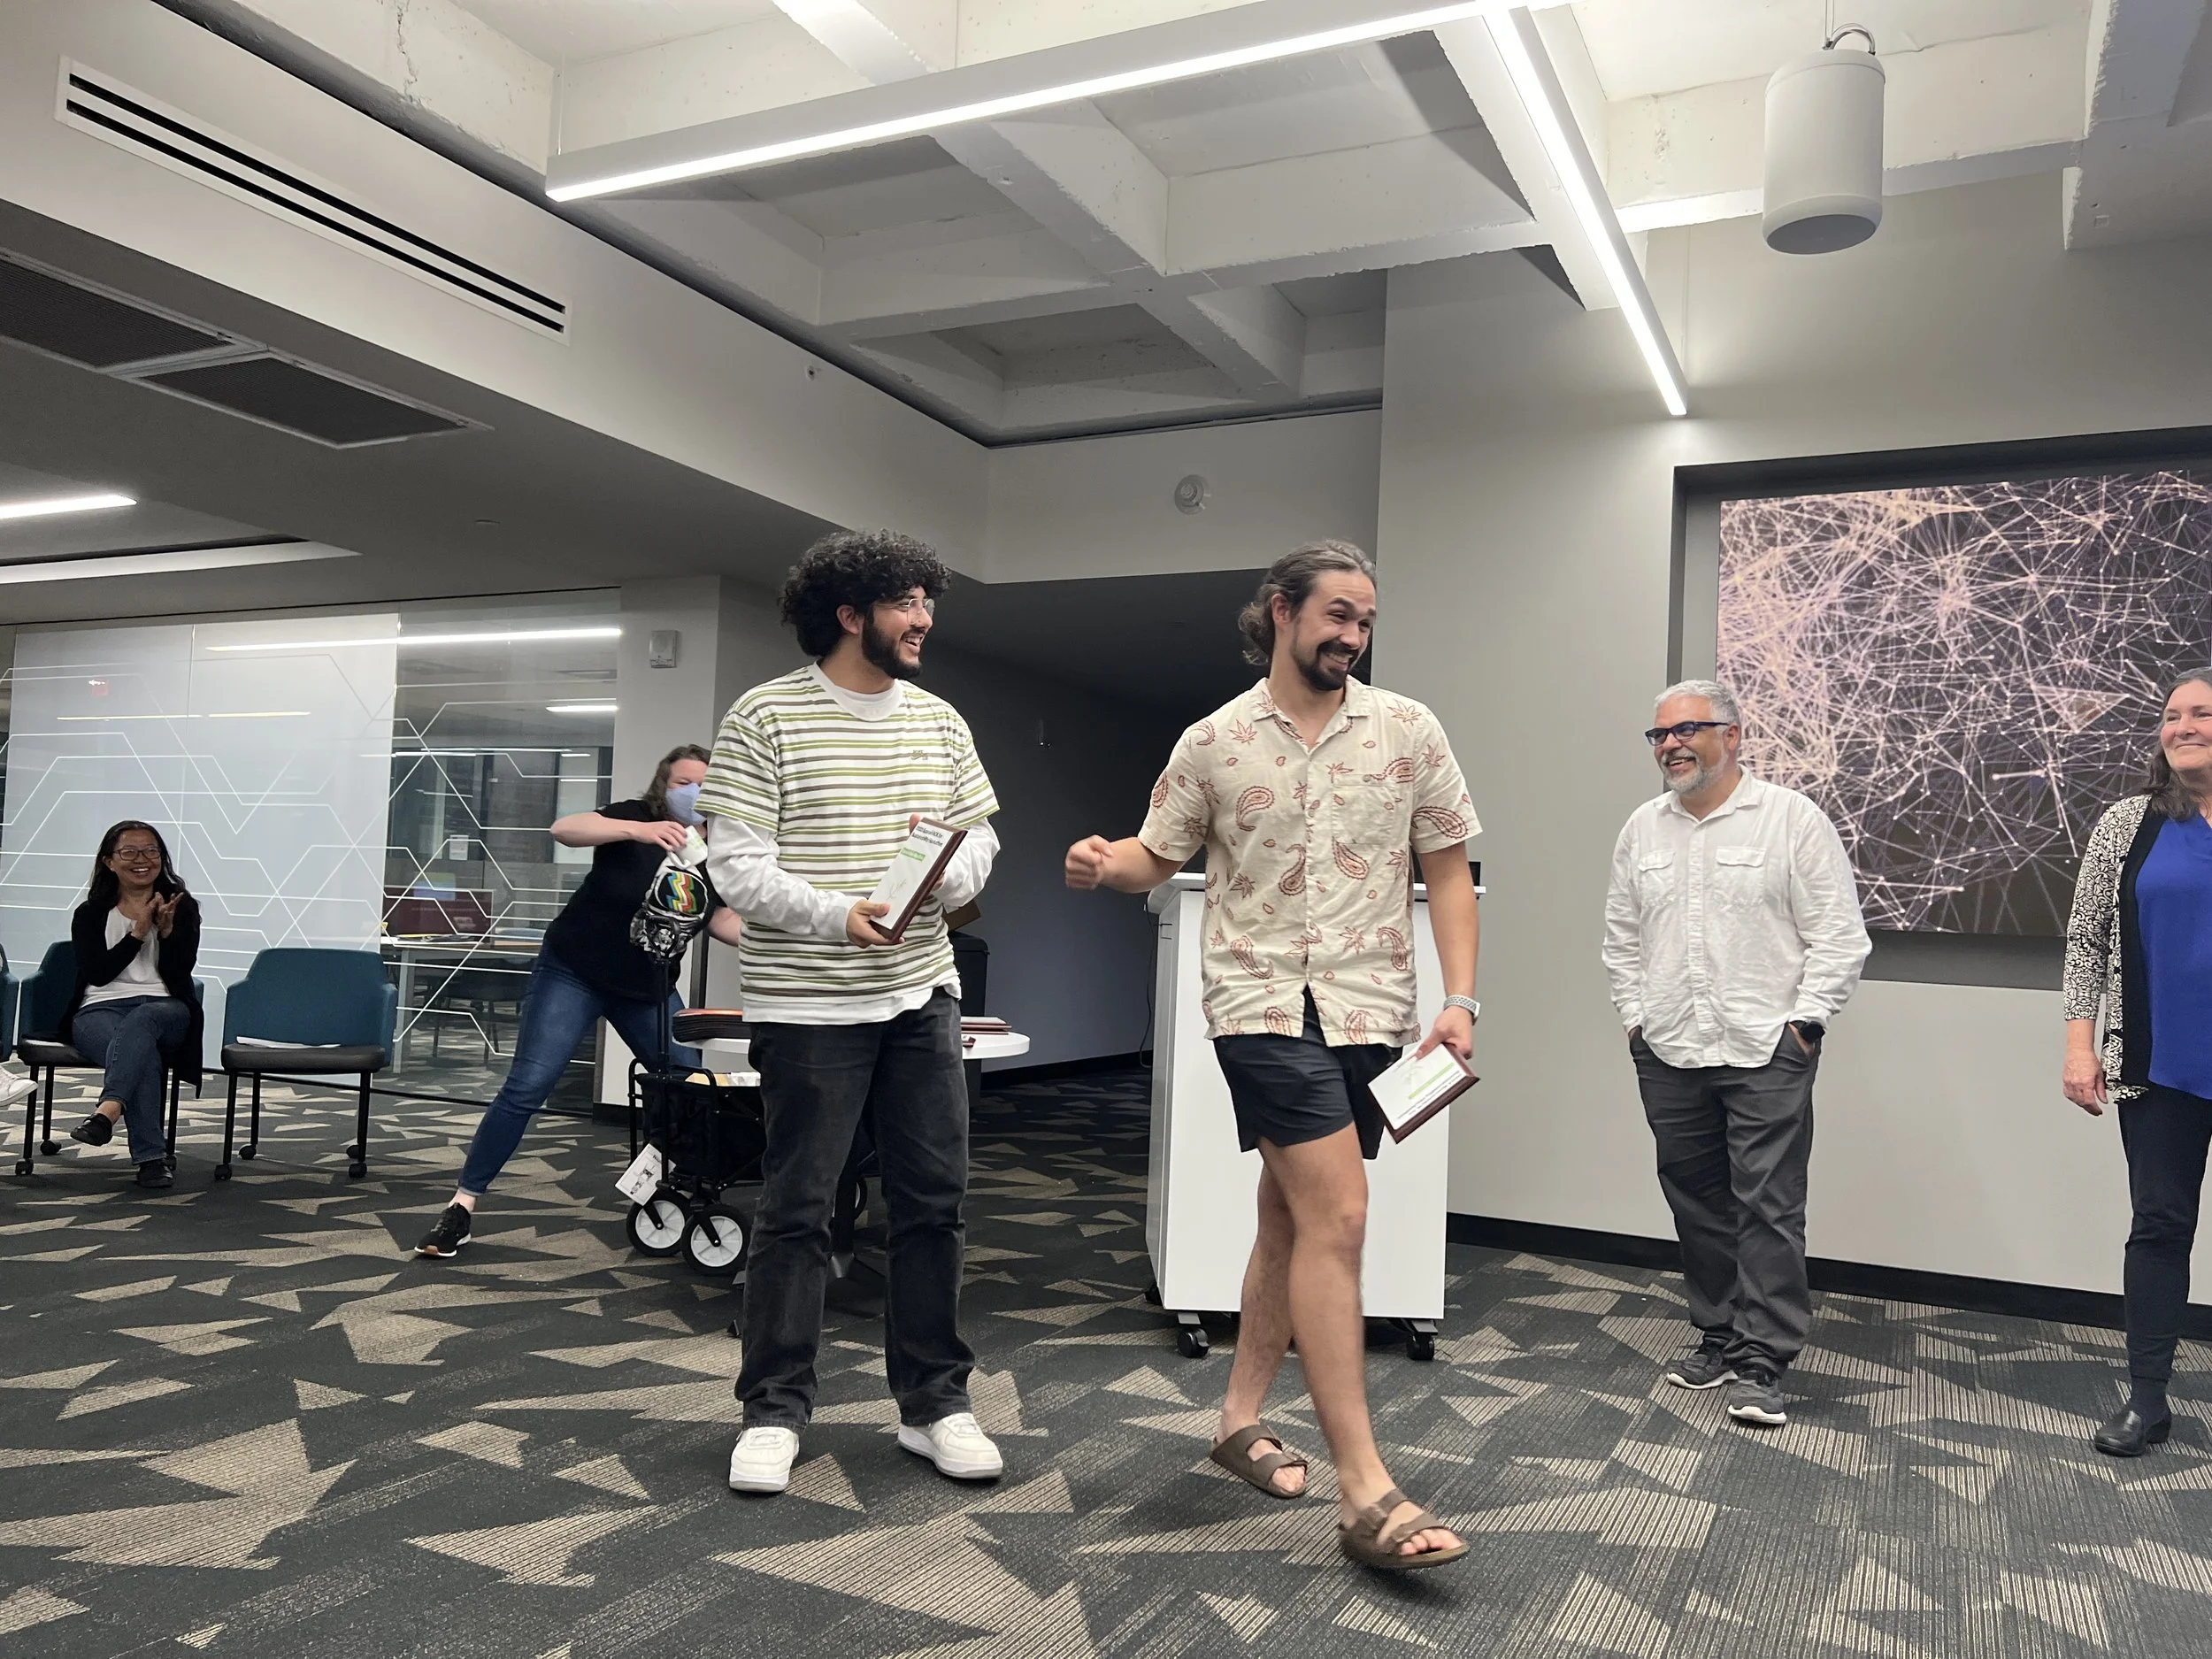
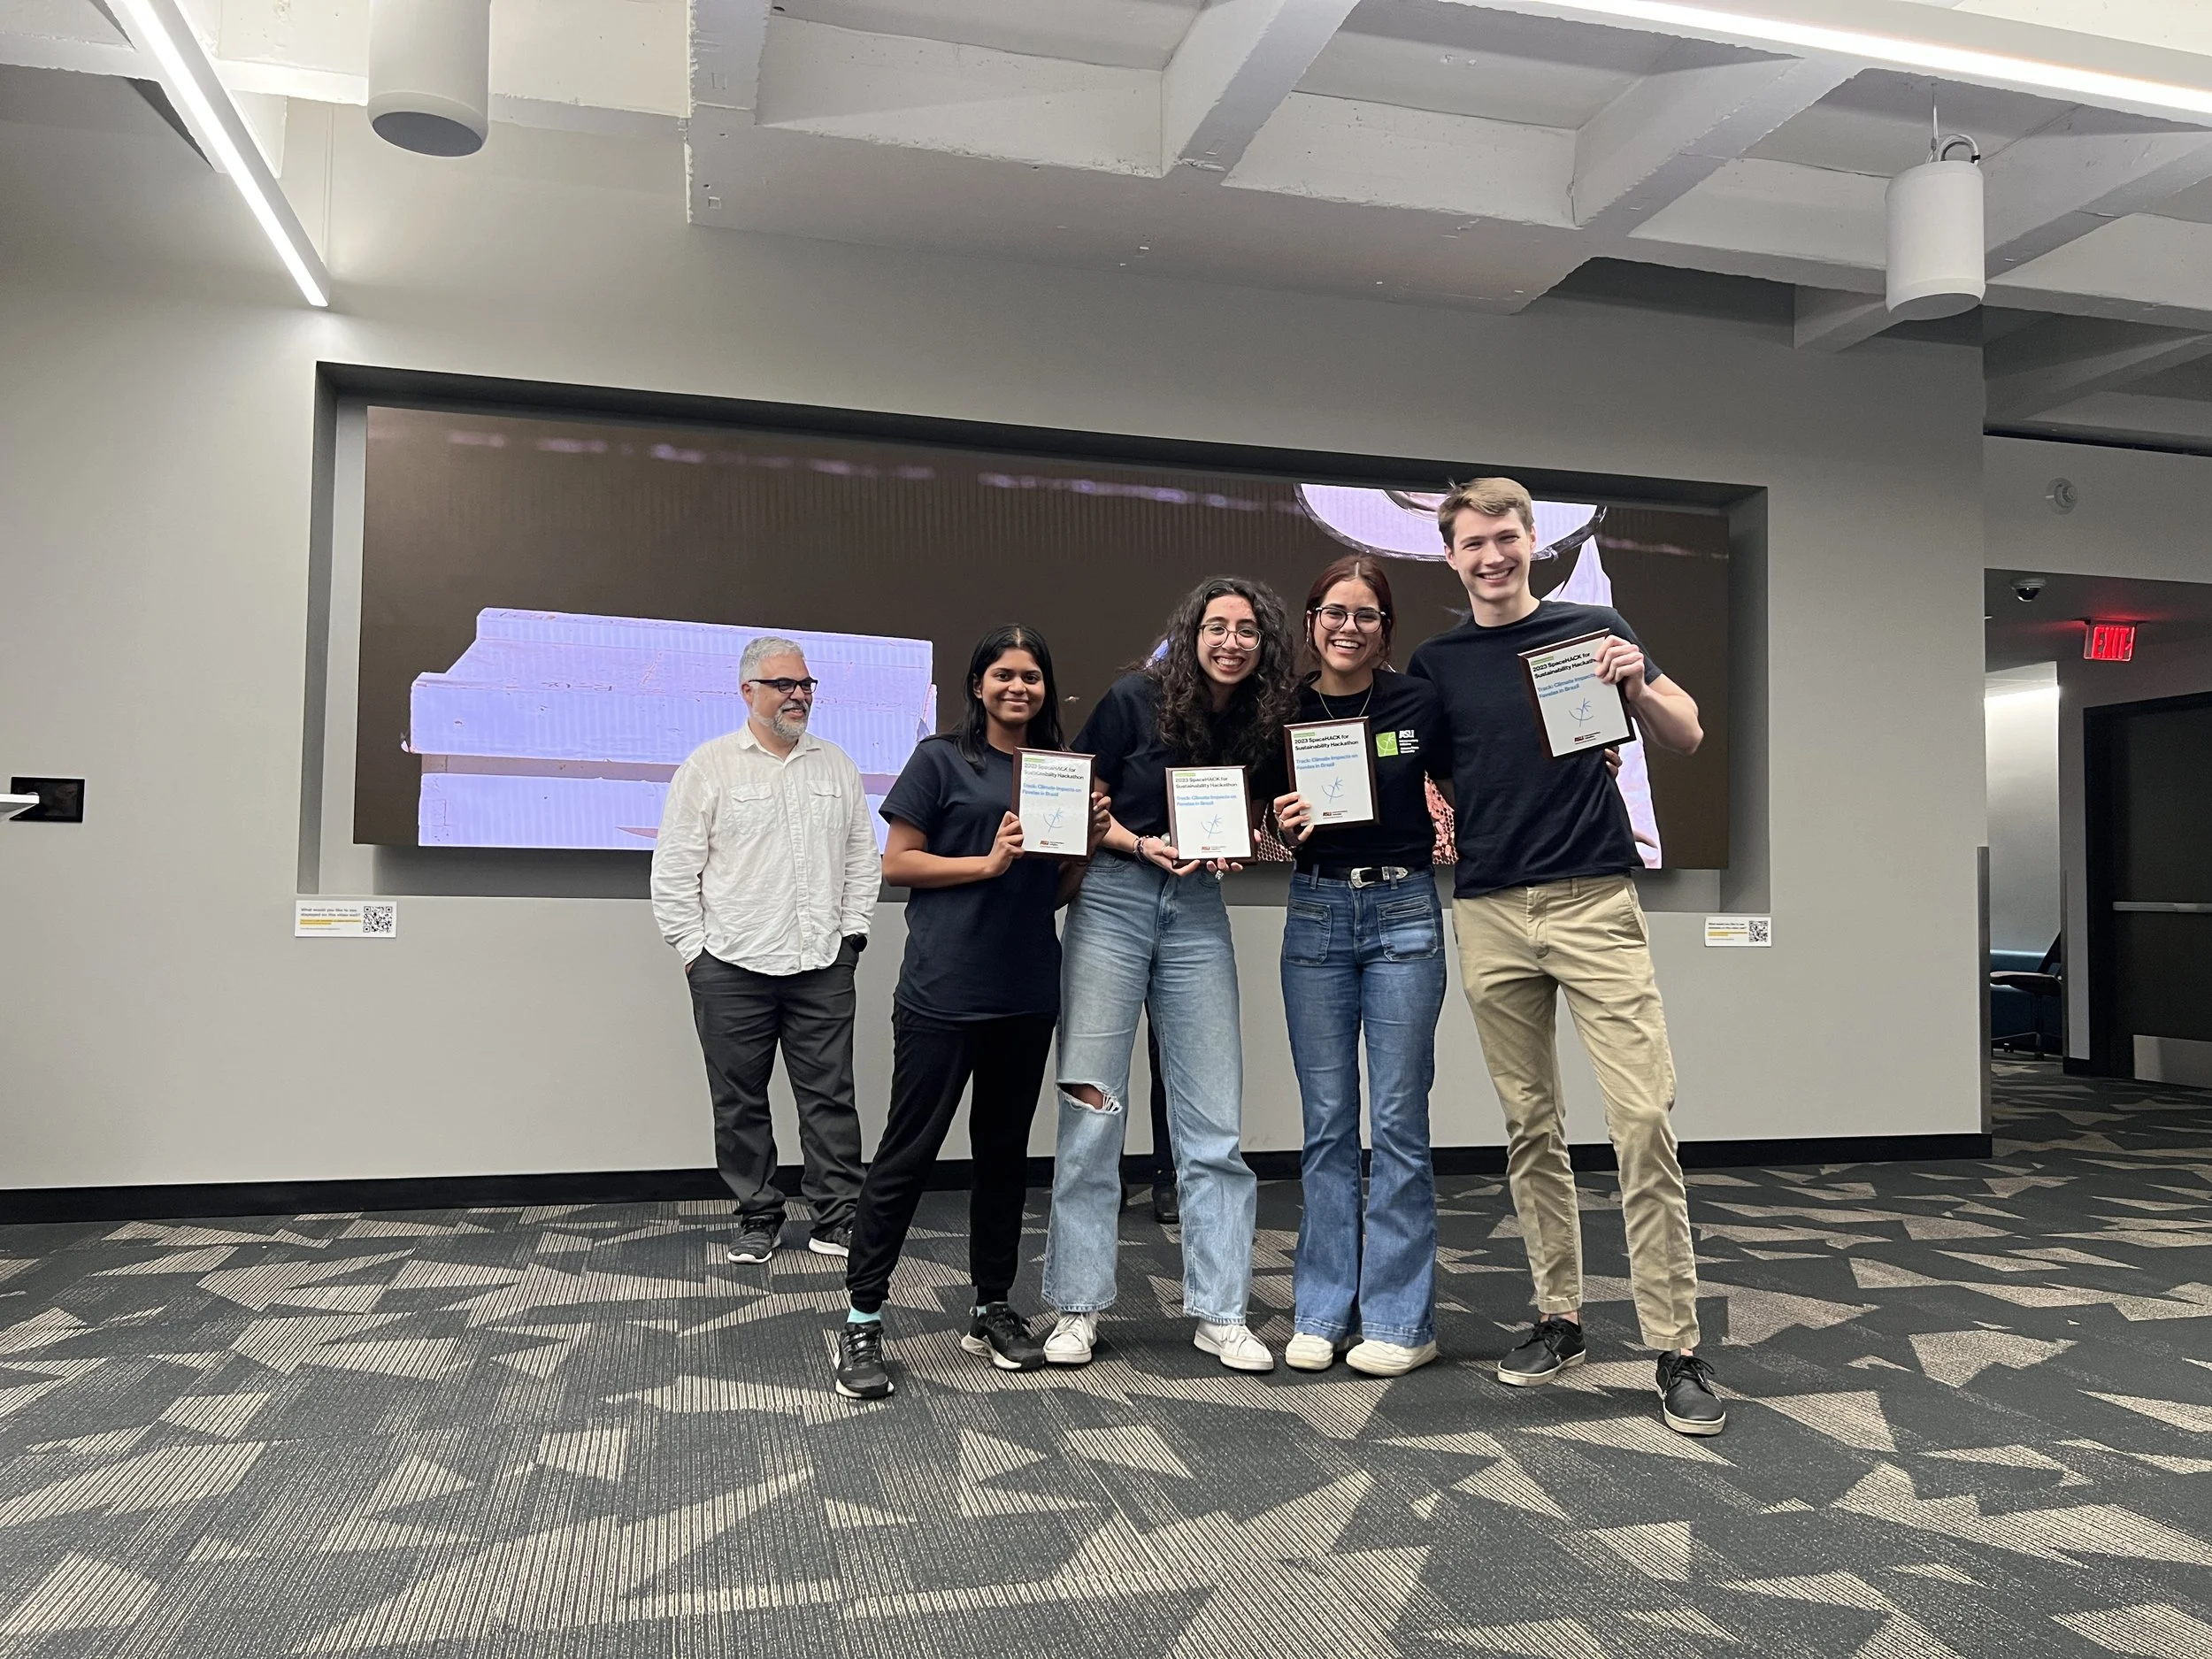
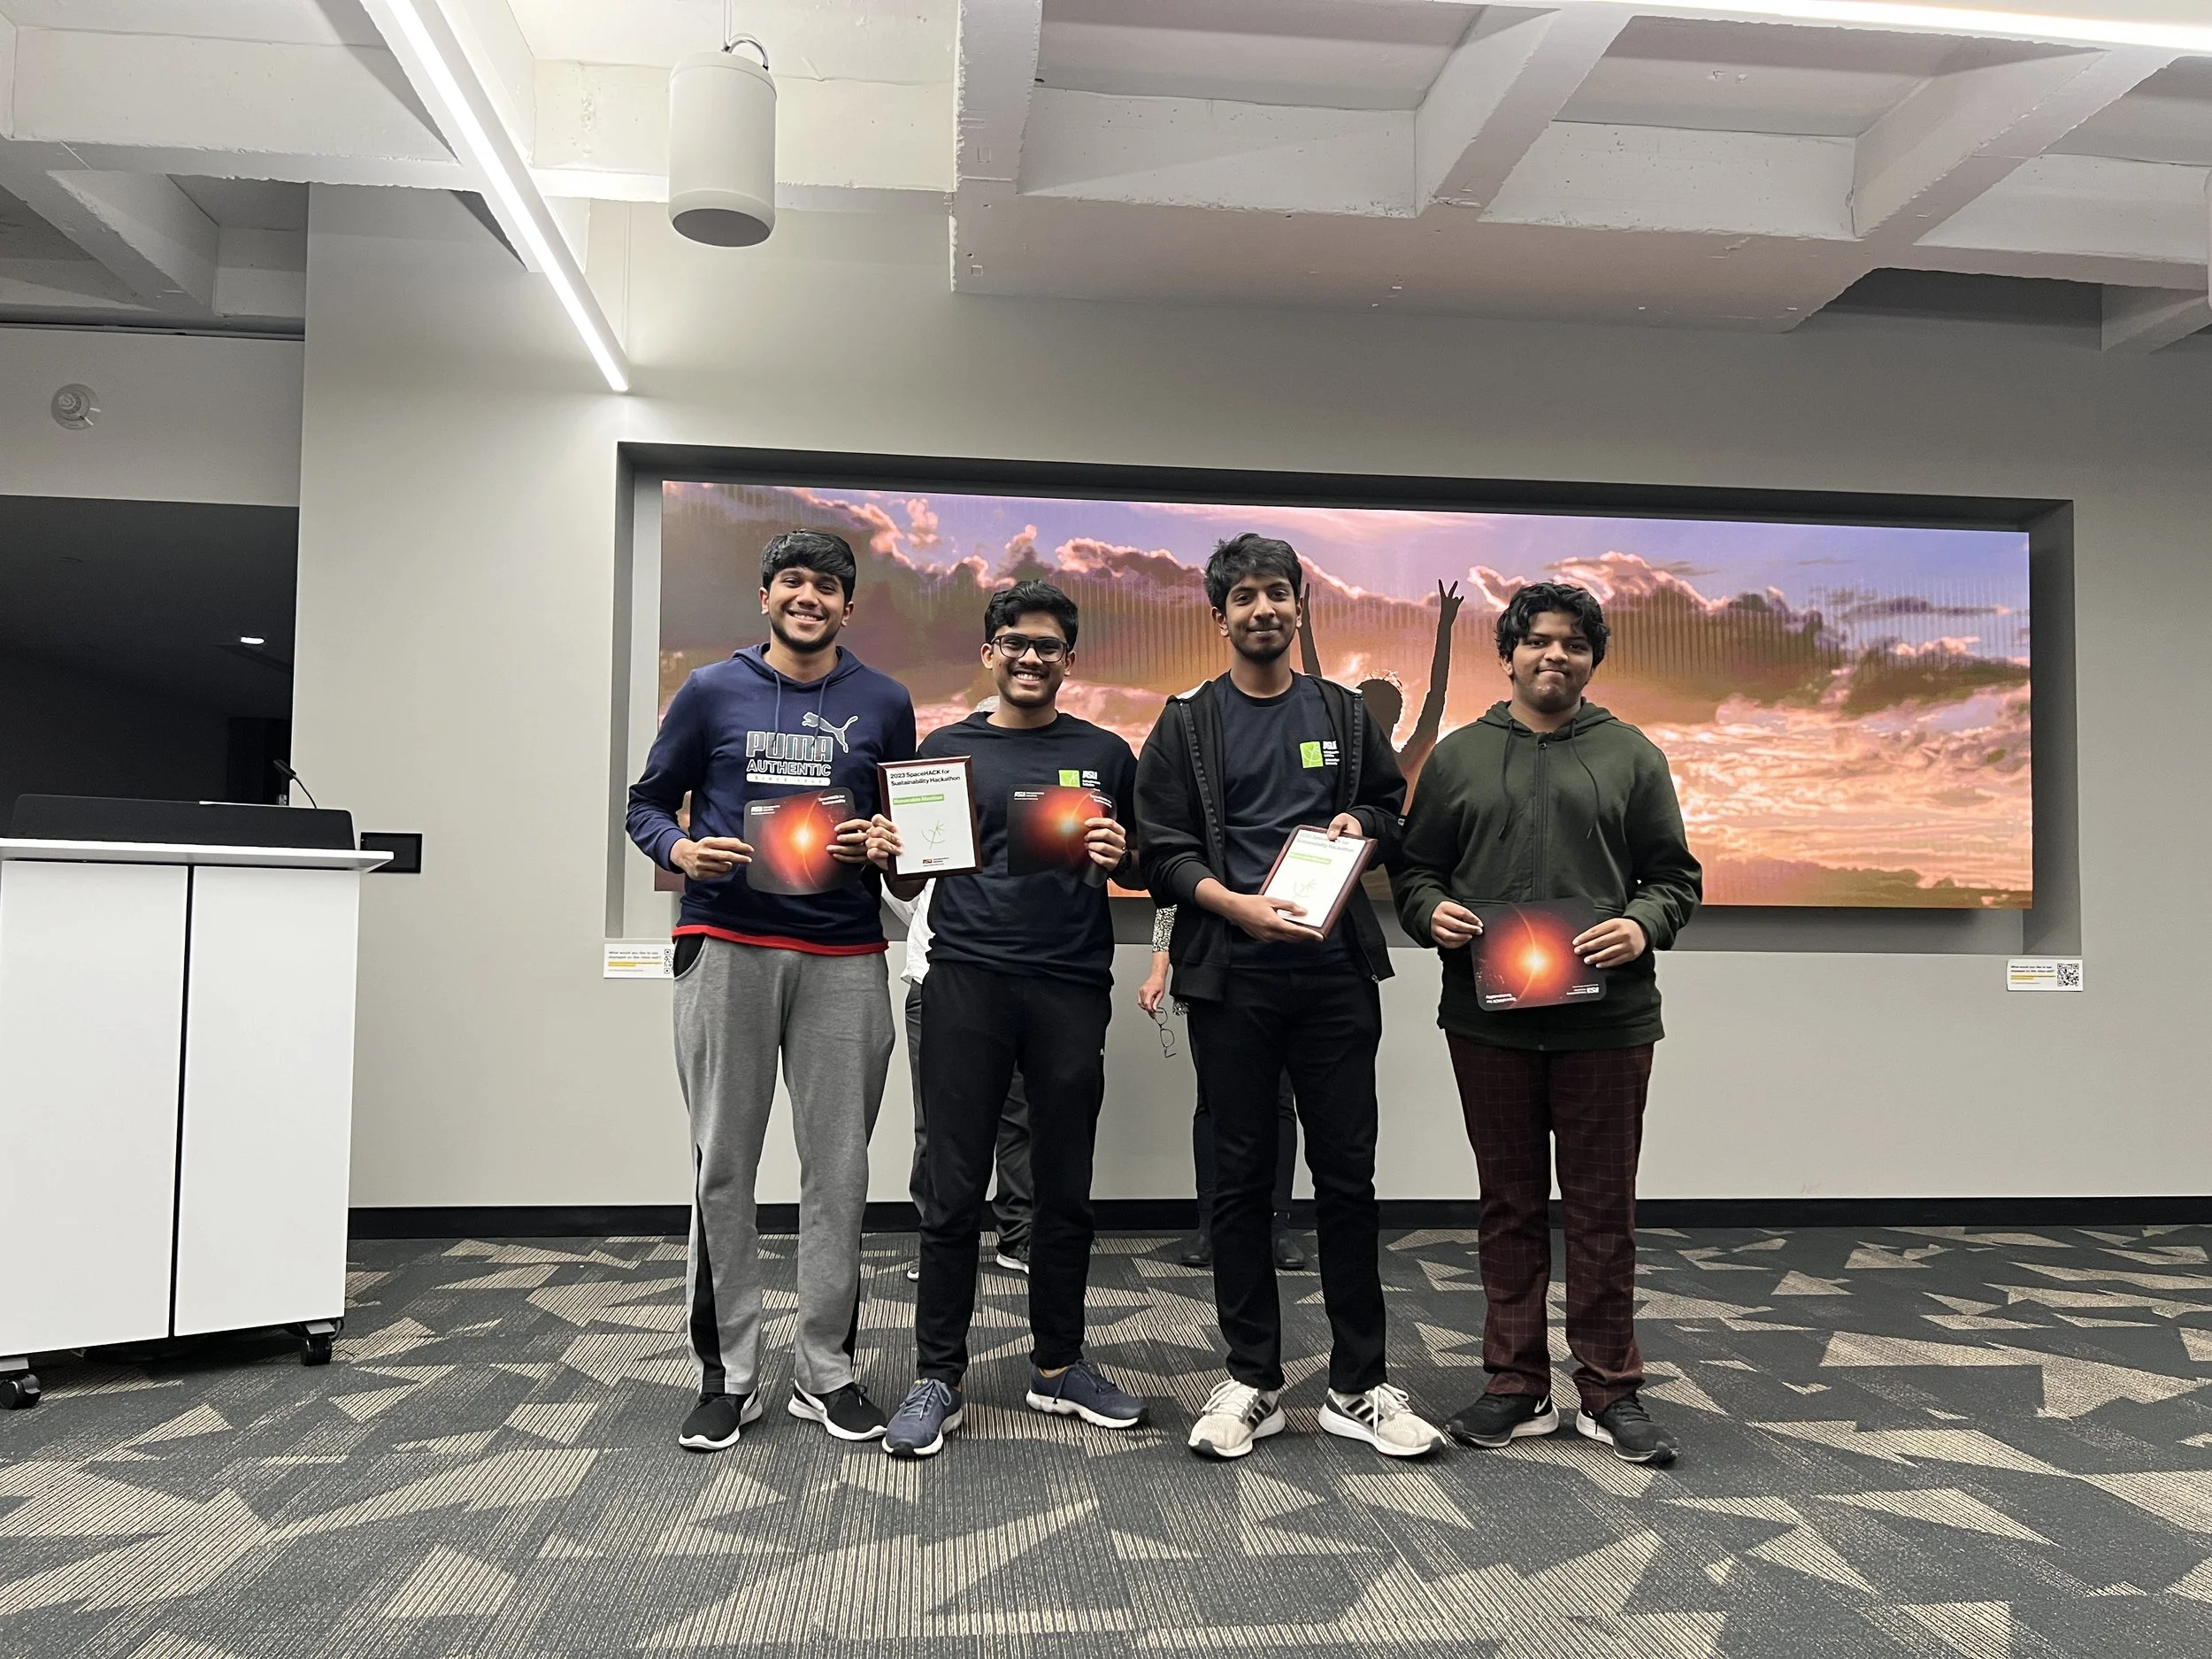
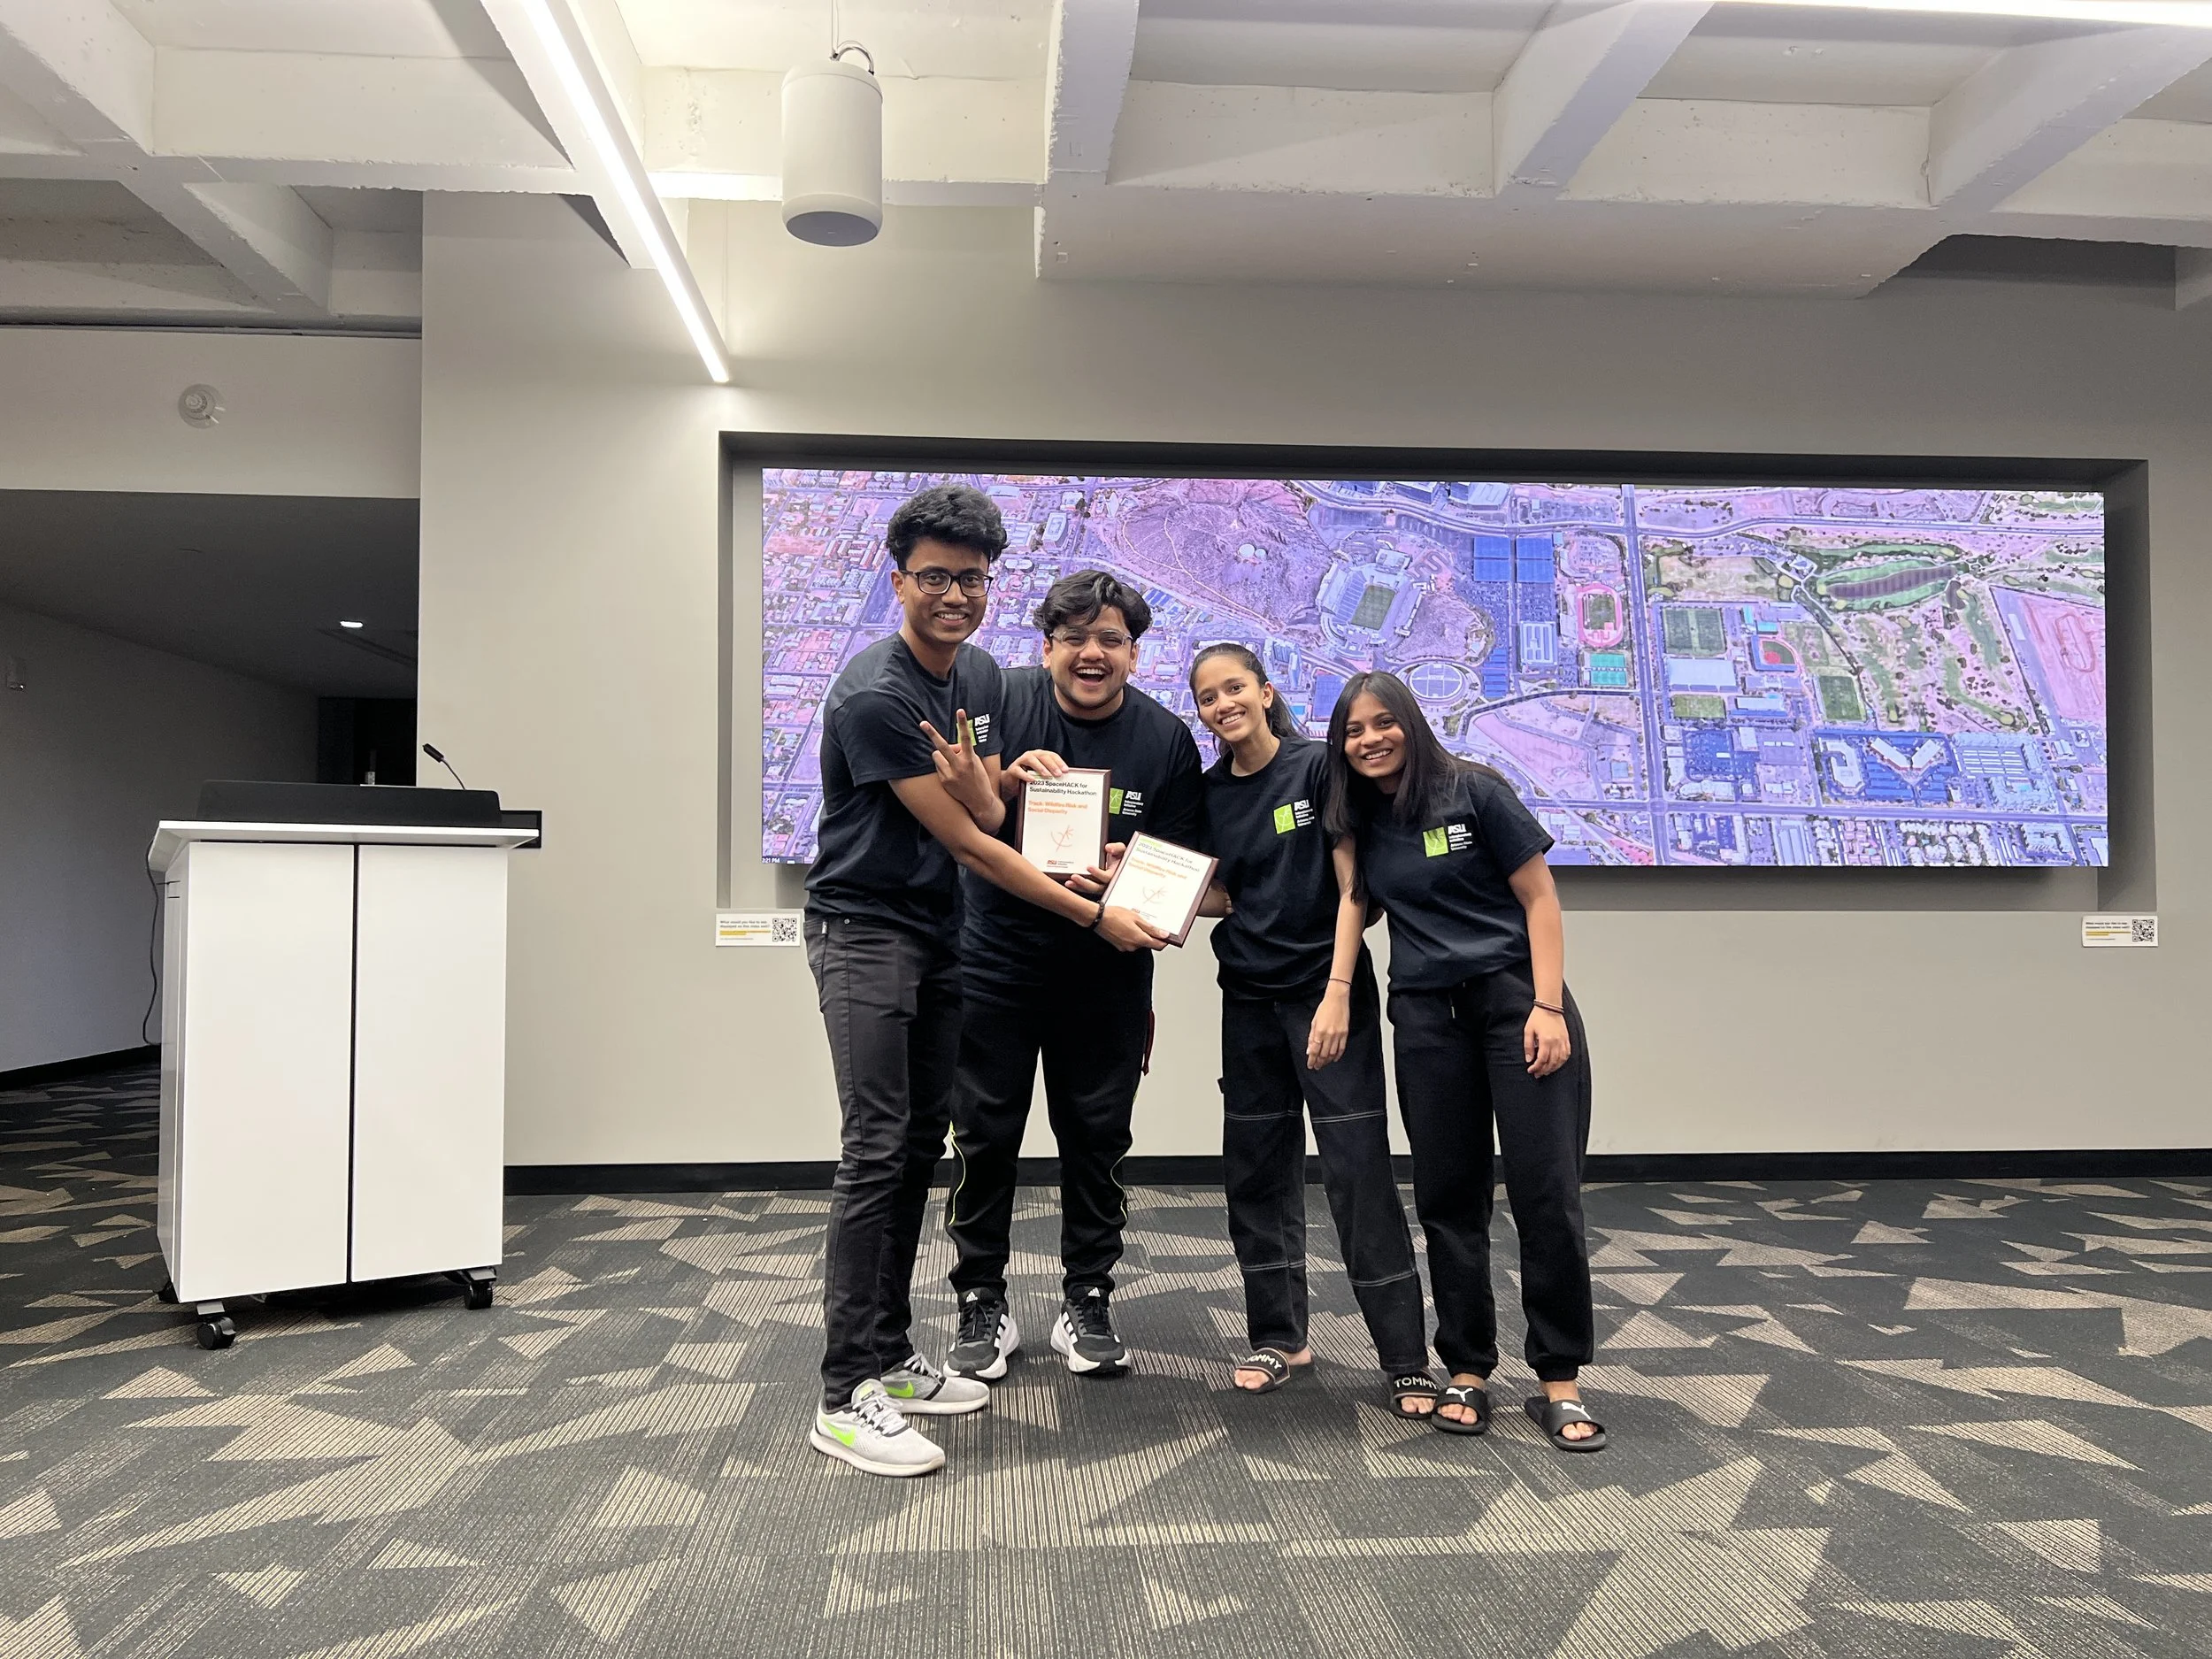
Winner Highlights
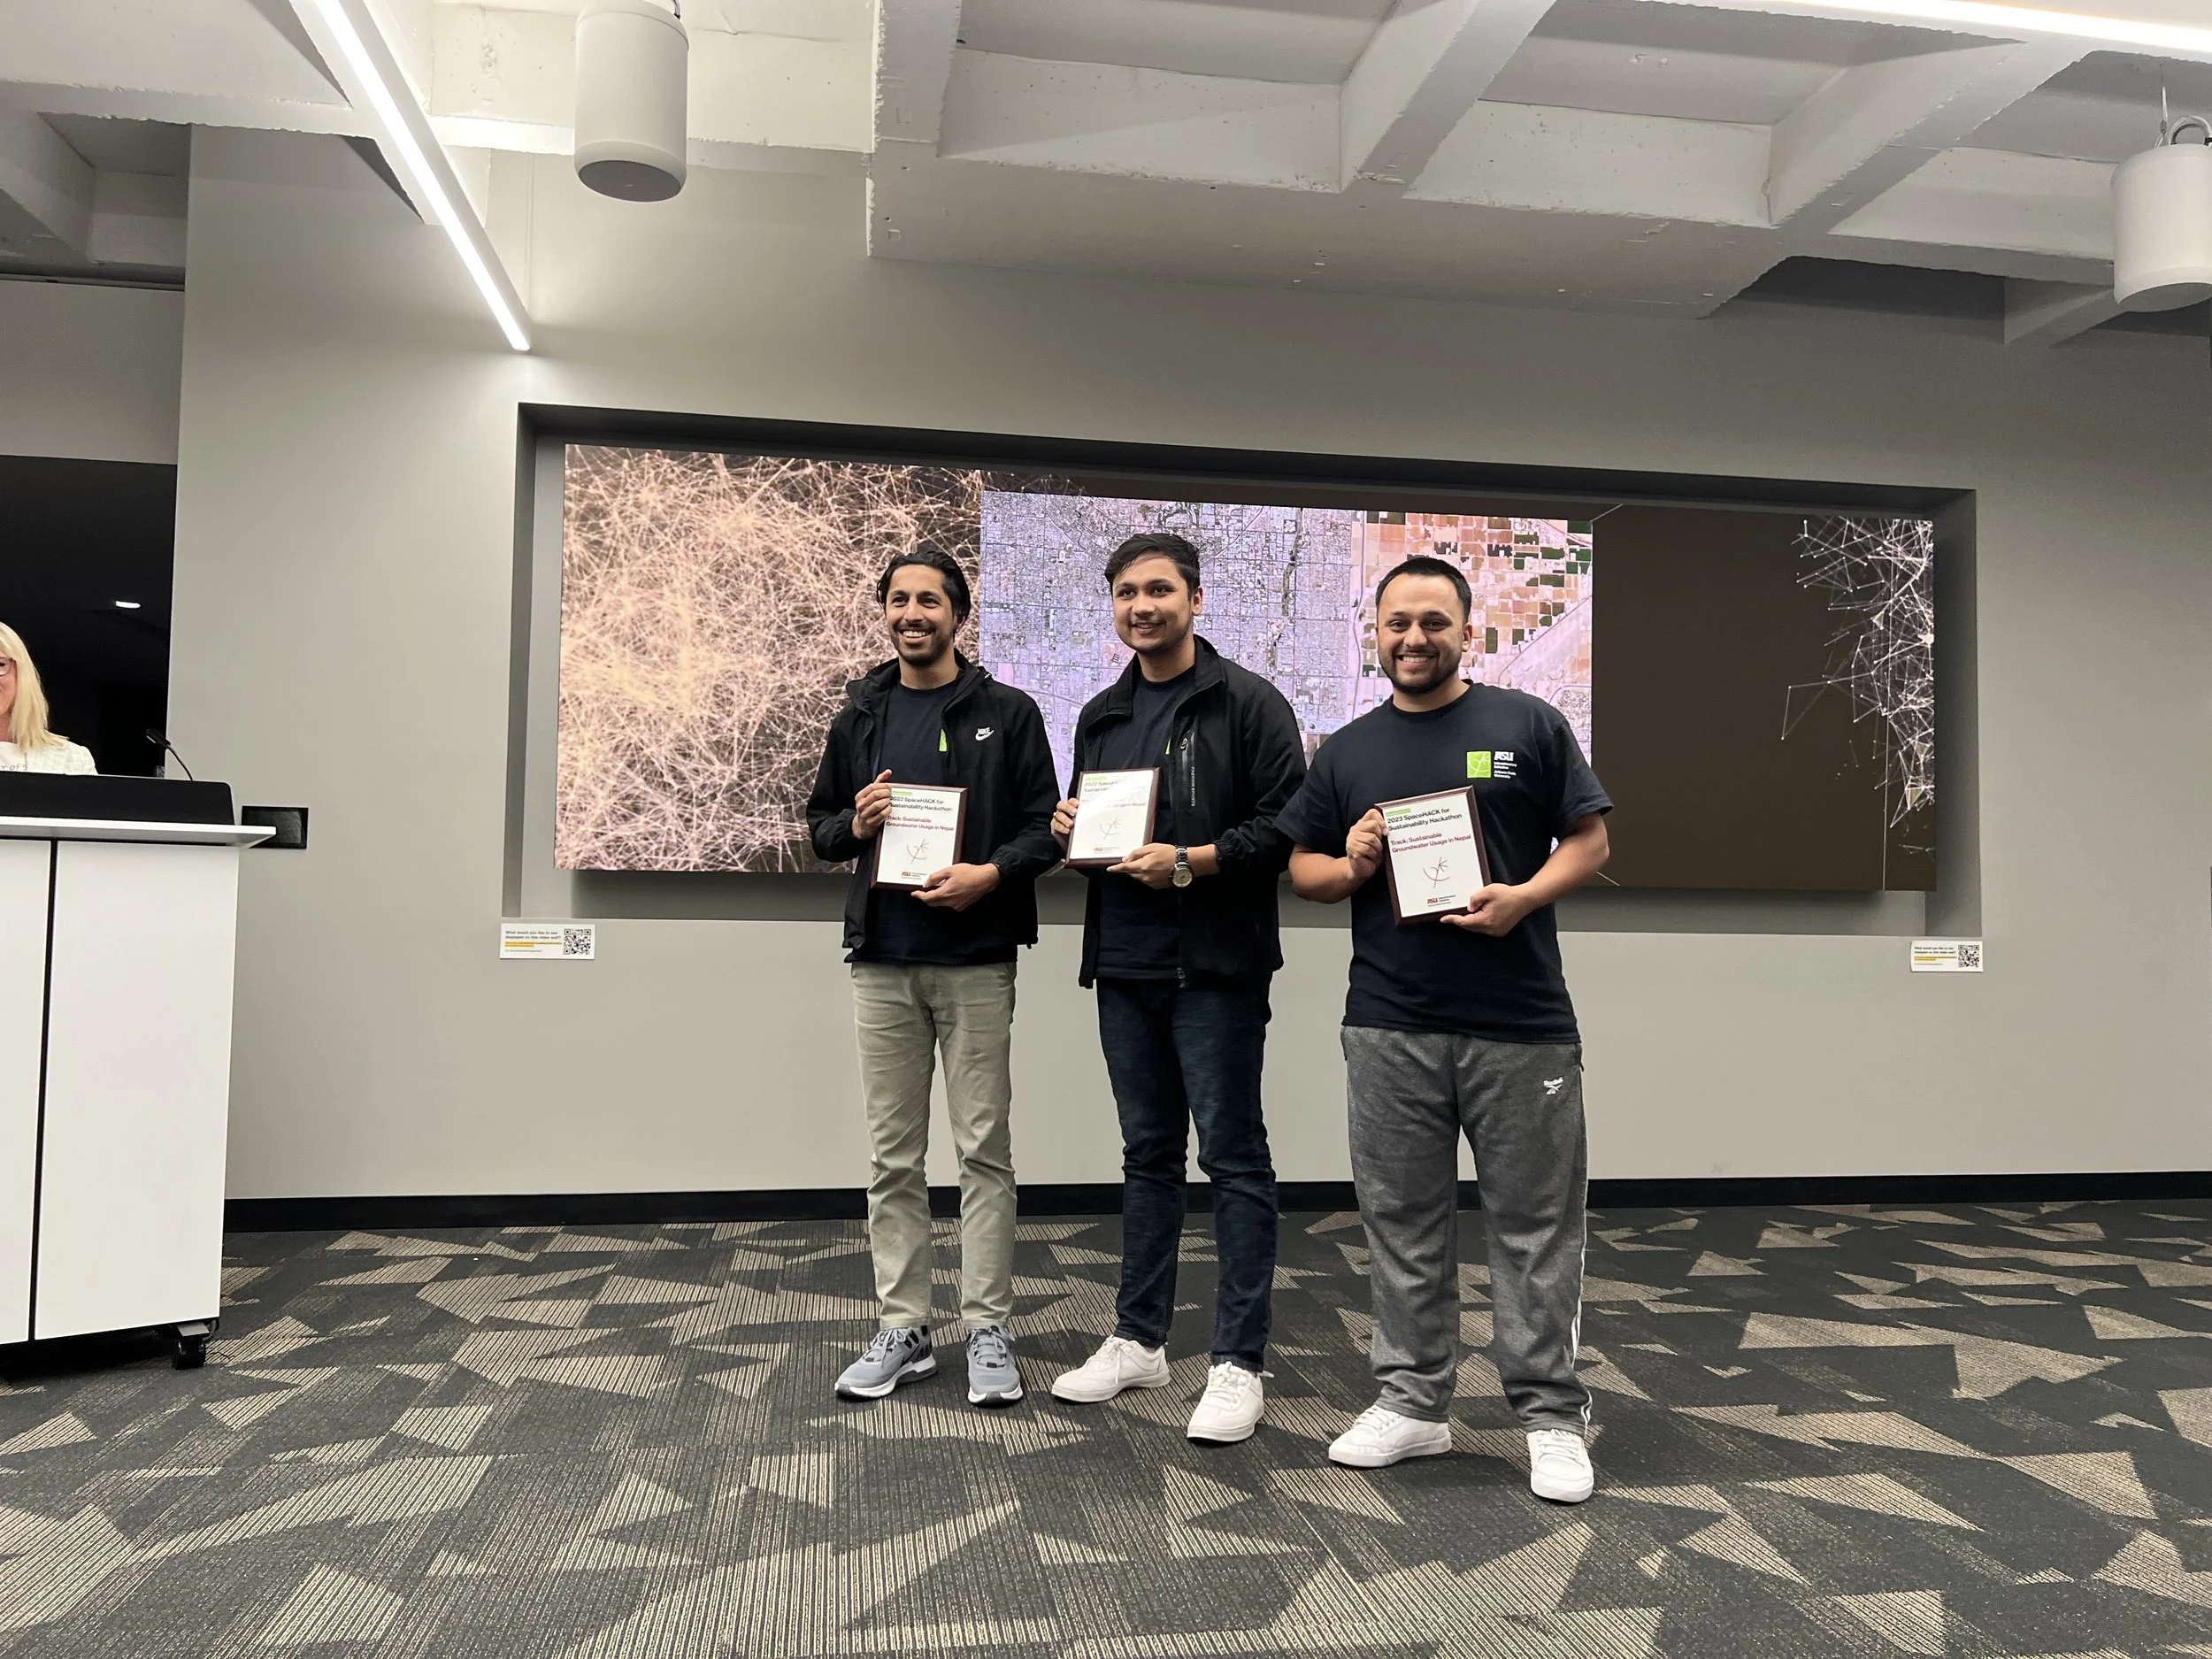
Track 1
Swastik Ghimire - Masters, Civil Engineering | Kshitij Dahal - Ph.D, Civil Engineering | Suraj Tiwari - Ph.D, Civil Engineering
After comparing measured groundwater level data with seven different datasets, this team found a strong correlation between ground data and GRACE (Earth’s gravitational field) satellite data. Mapping this across the entire country shows that Western Nepal is experiencing more pronounced groundwater decline, which can be attributed to droughts, increased irrigation, and population growth. They propose solutions including: drip irrigation, redirecting groundwater to porous soil, porous concrete in urban areas, and treated wastewater for irrigation or industrial purposes.
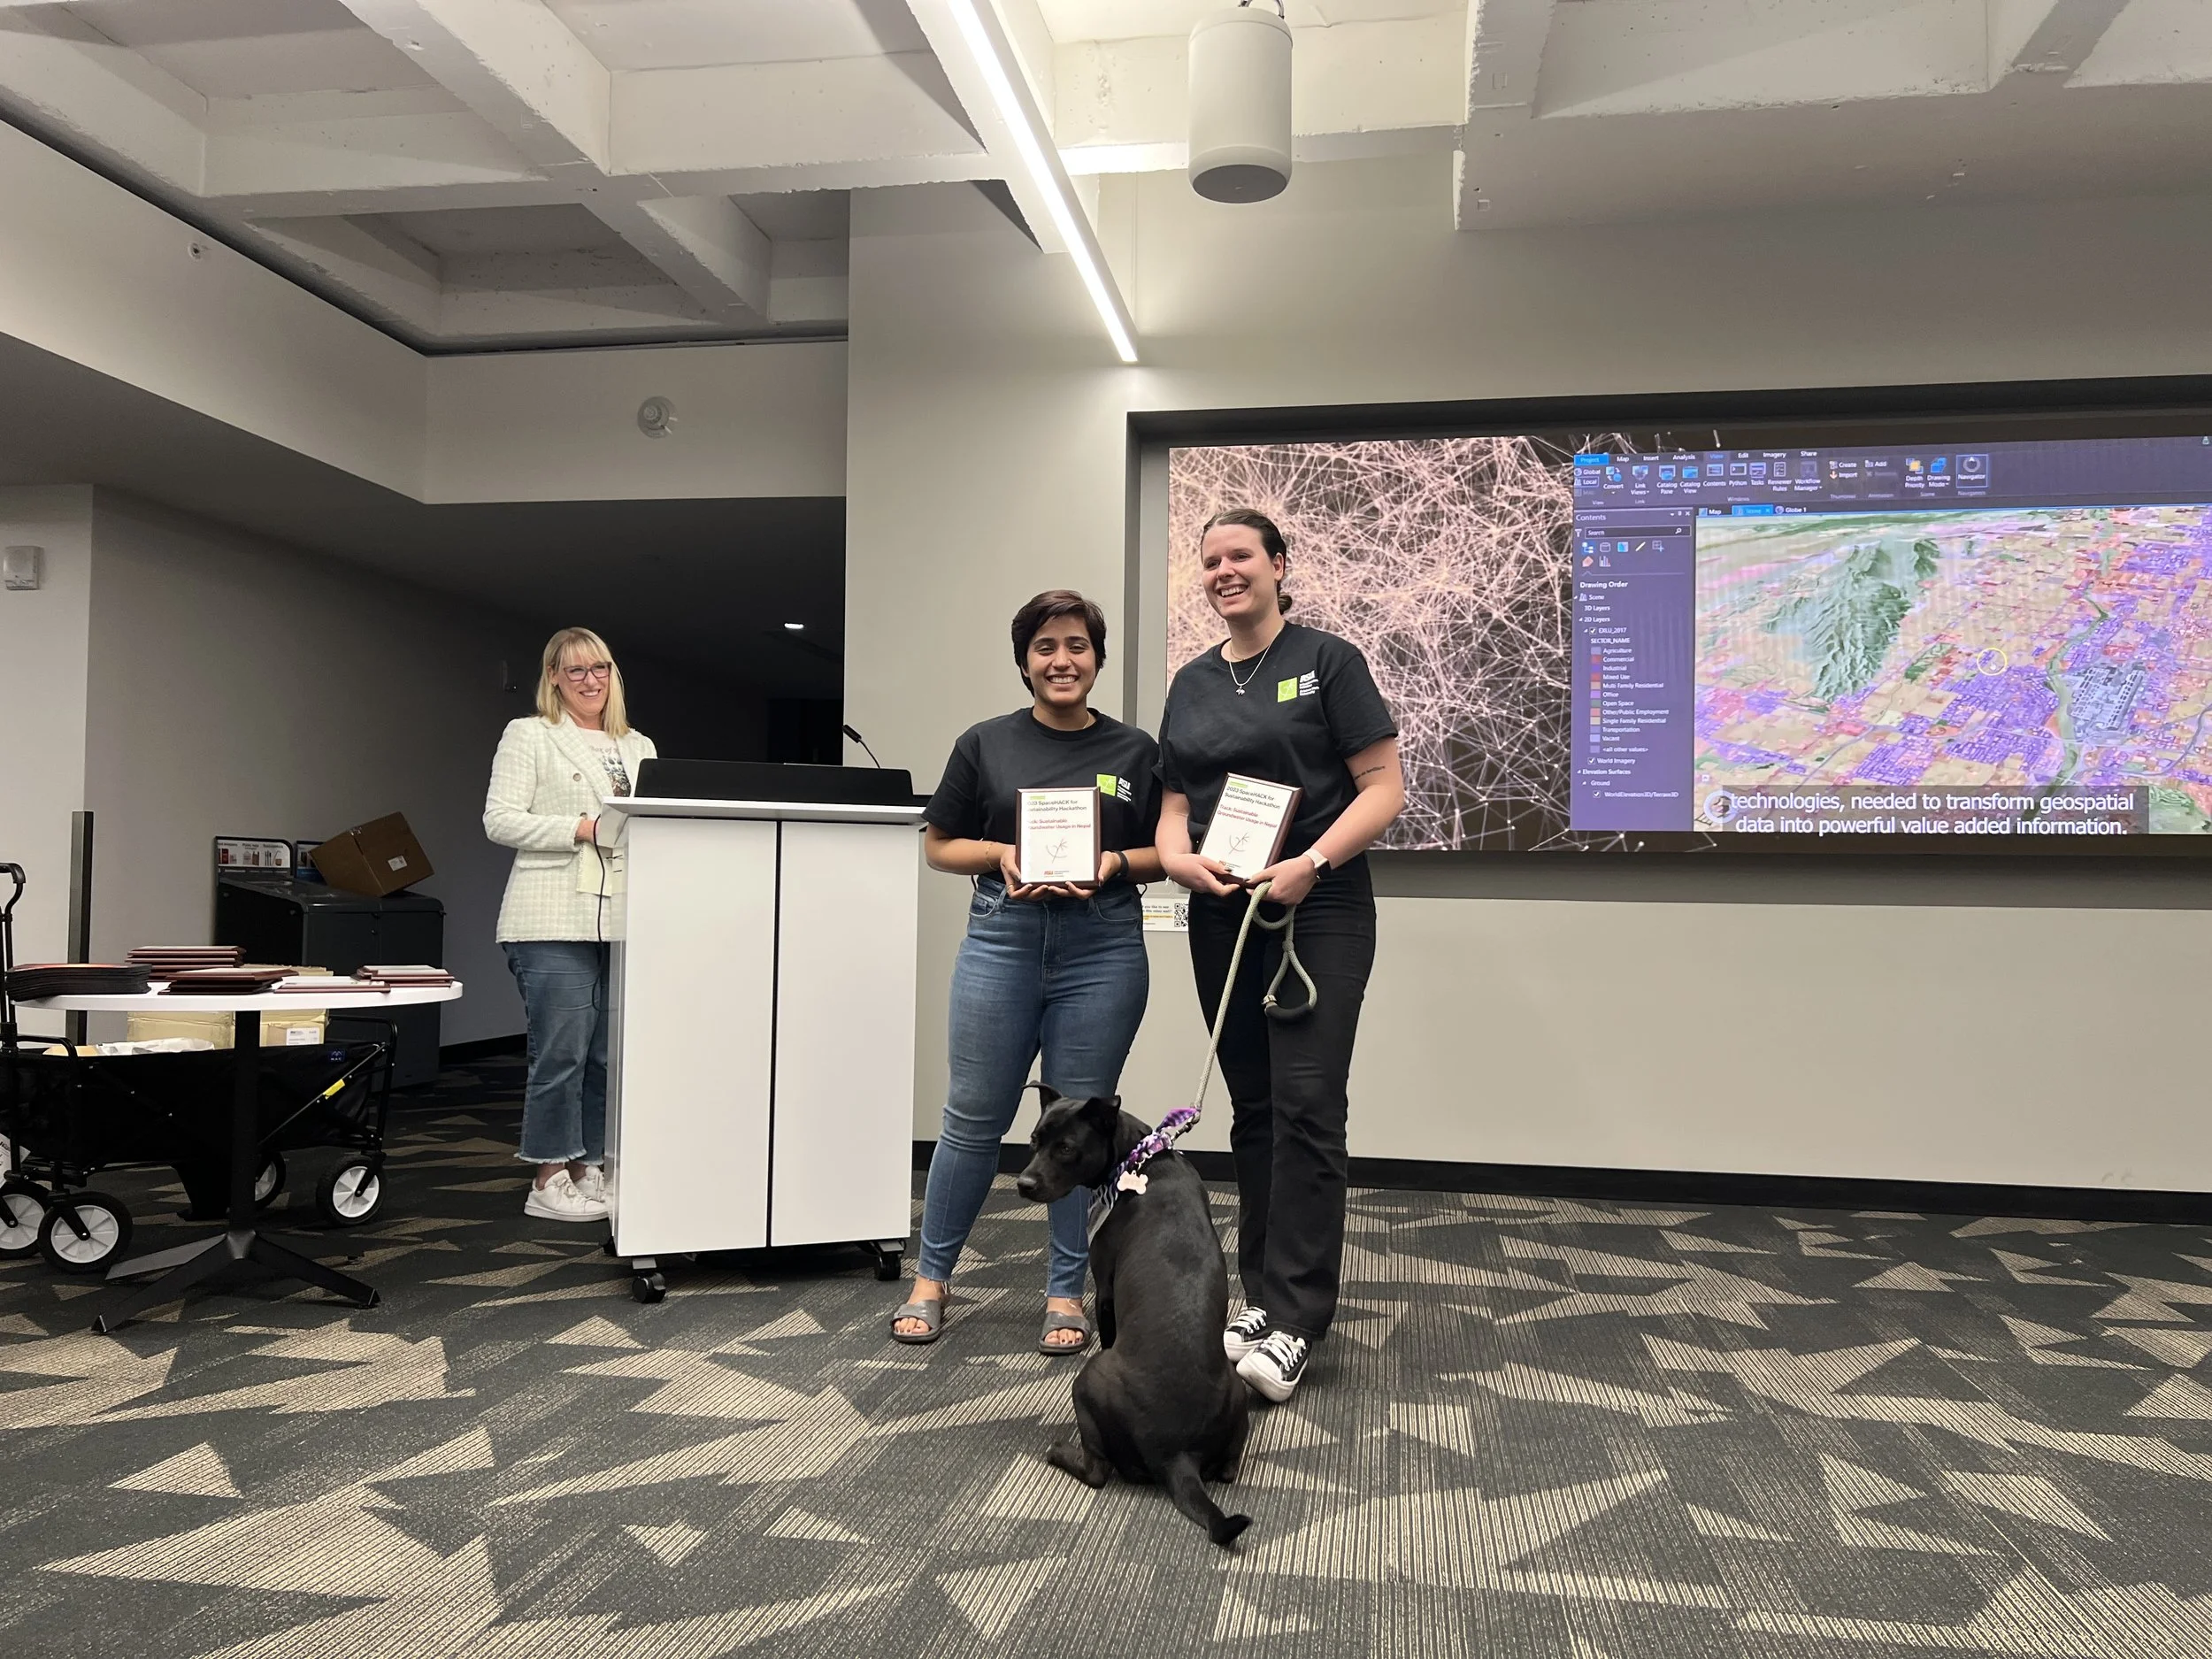
Prashamsa Thapa - Ph.D, Innov. in Global Development | Giulia Genna - Ph.D, Innov. in Global Development | Oceane Ingram - Sophomore, Electrical Engineering
This team first conducted a ground data analysis, where NDWI (plant water), NDVI (vegetation), and SMAP (soil moisture) satellite datasets were compared with measured groundwater levels and found a positive correlation between ground data and NDWI. The team then tested this hypothesis on two cases: Nawalparasi and Rautahat districts. These sites showed similar trends, suggesting the replicability of this algorithm. A governance model for groundwater was proposed that included NDWI but also socio-economic factors, migratory patterns, and demographics.
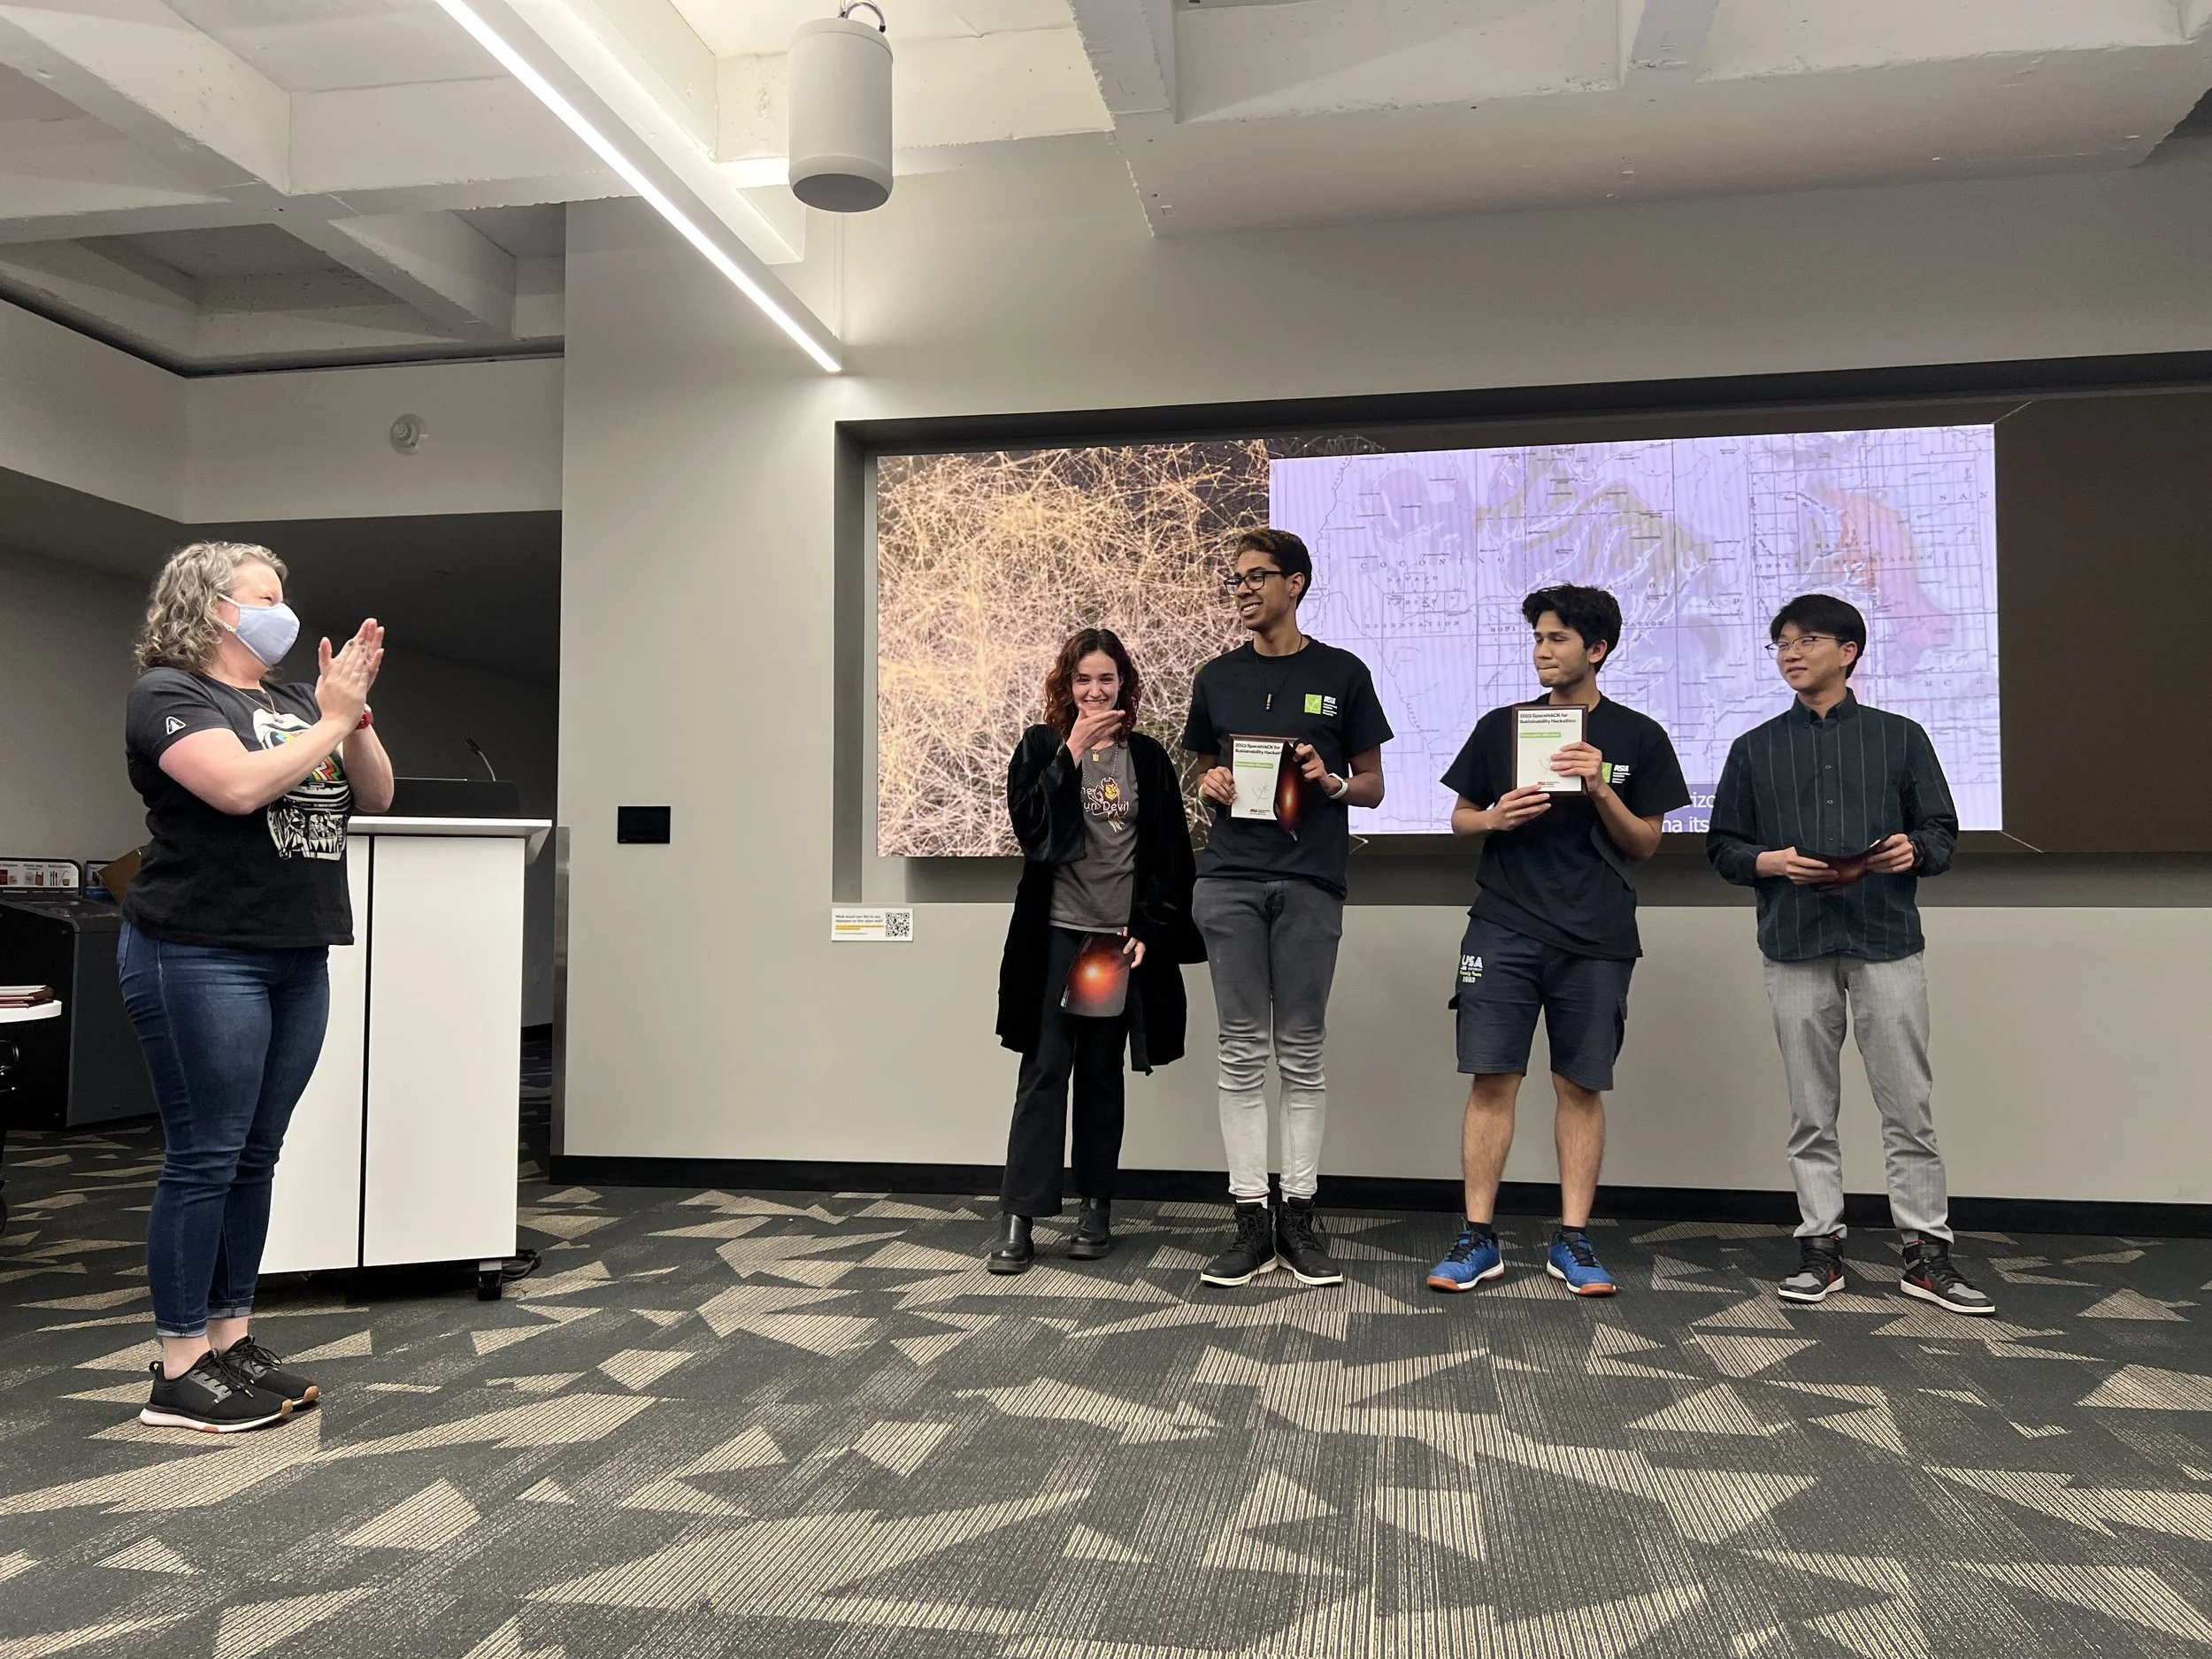
Track 2
Elizabeth Garayzar - Sophomore, Exploration Systems | Tasha Coelho - Sophomore, Exploration Systems | Lucas Barduson - Junior, Aerospace Engineering | Gabriella Nakleh - Junior, Aerospace Engineering
This team identified a strong correlation between previous landslide locations and precipitation + land slope. These high risk regions were shown to coincide with high population density, indicating favelas (often built on undesirable land). They then proposed using Facebook and Whatsapp as a platform for an early-warning system and public outreach to NGOs for the creation of emergency shelters in lower risk areas for use during extreme weather. The government could also implement Flood Resilient Strategies in these high risk areas.
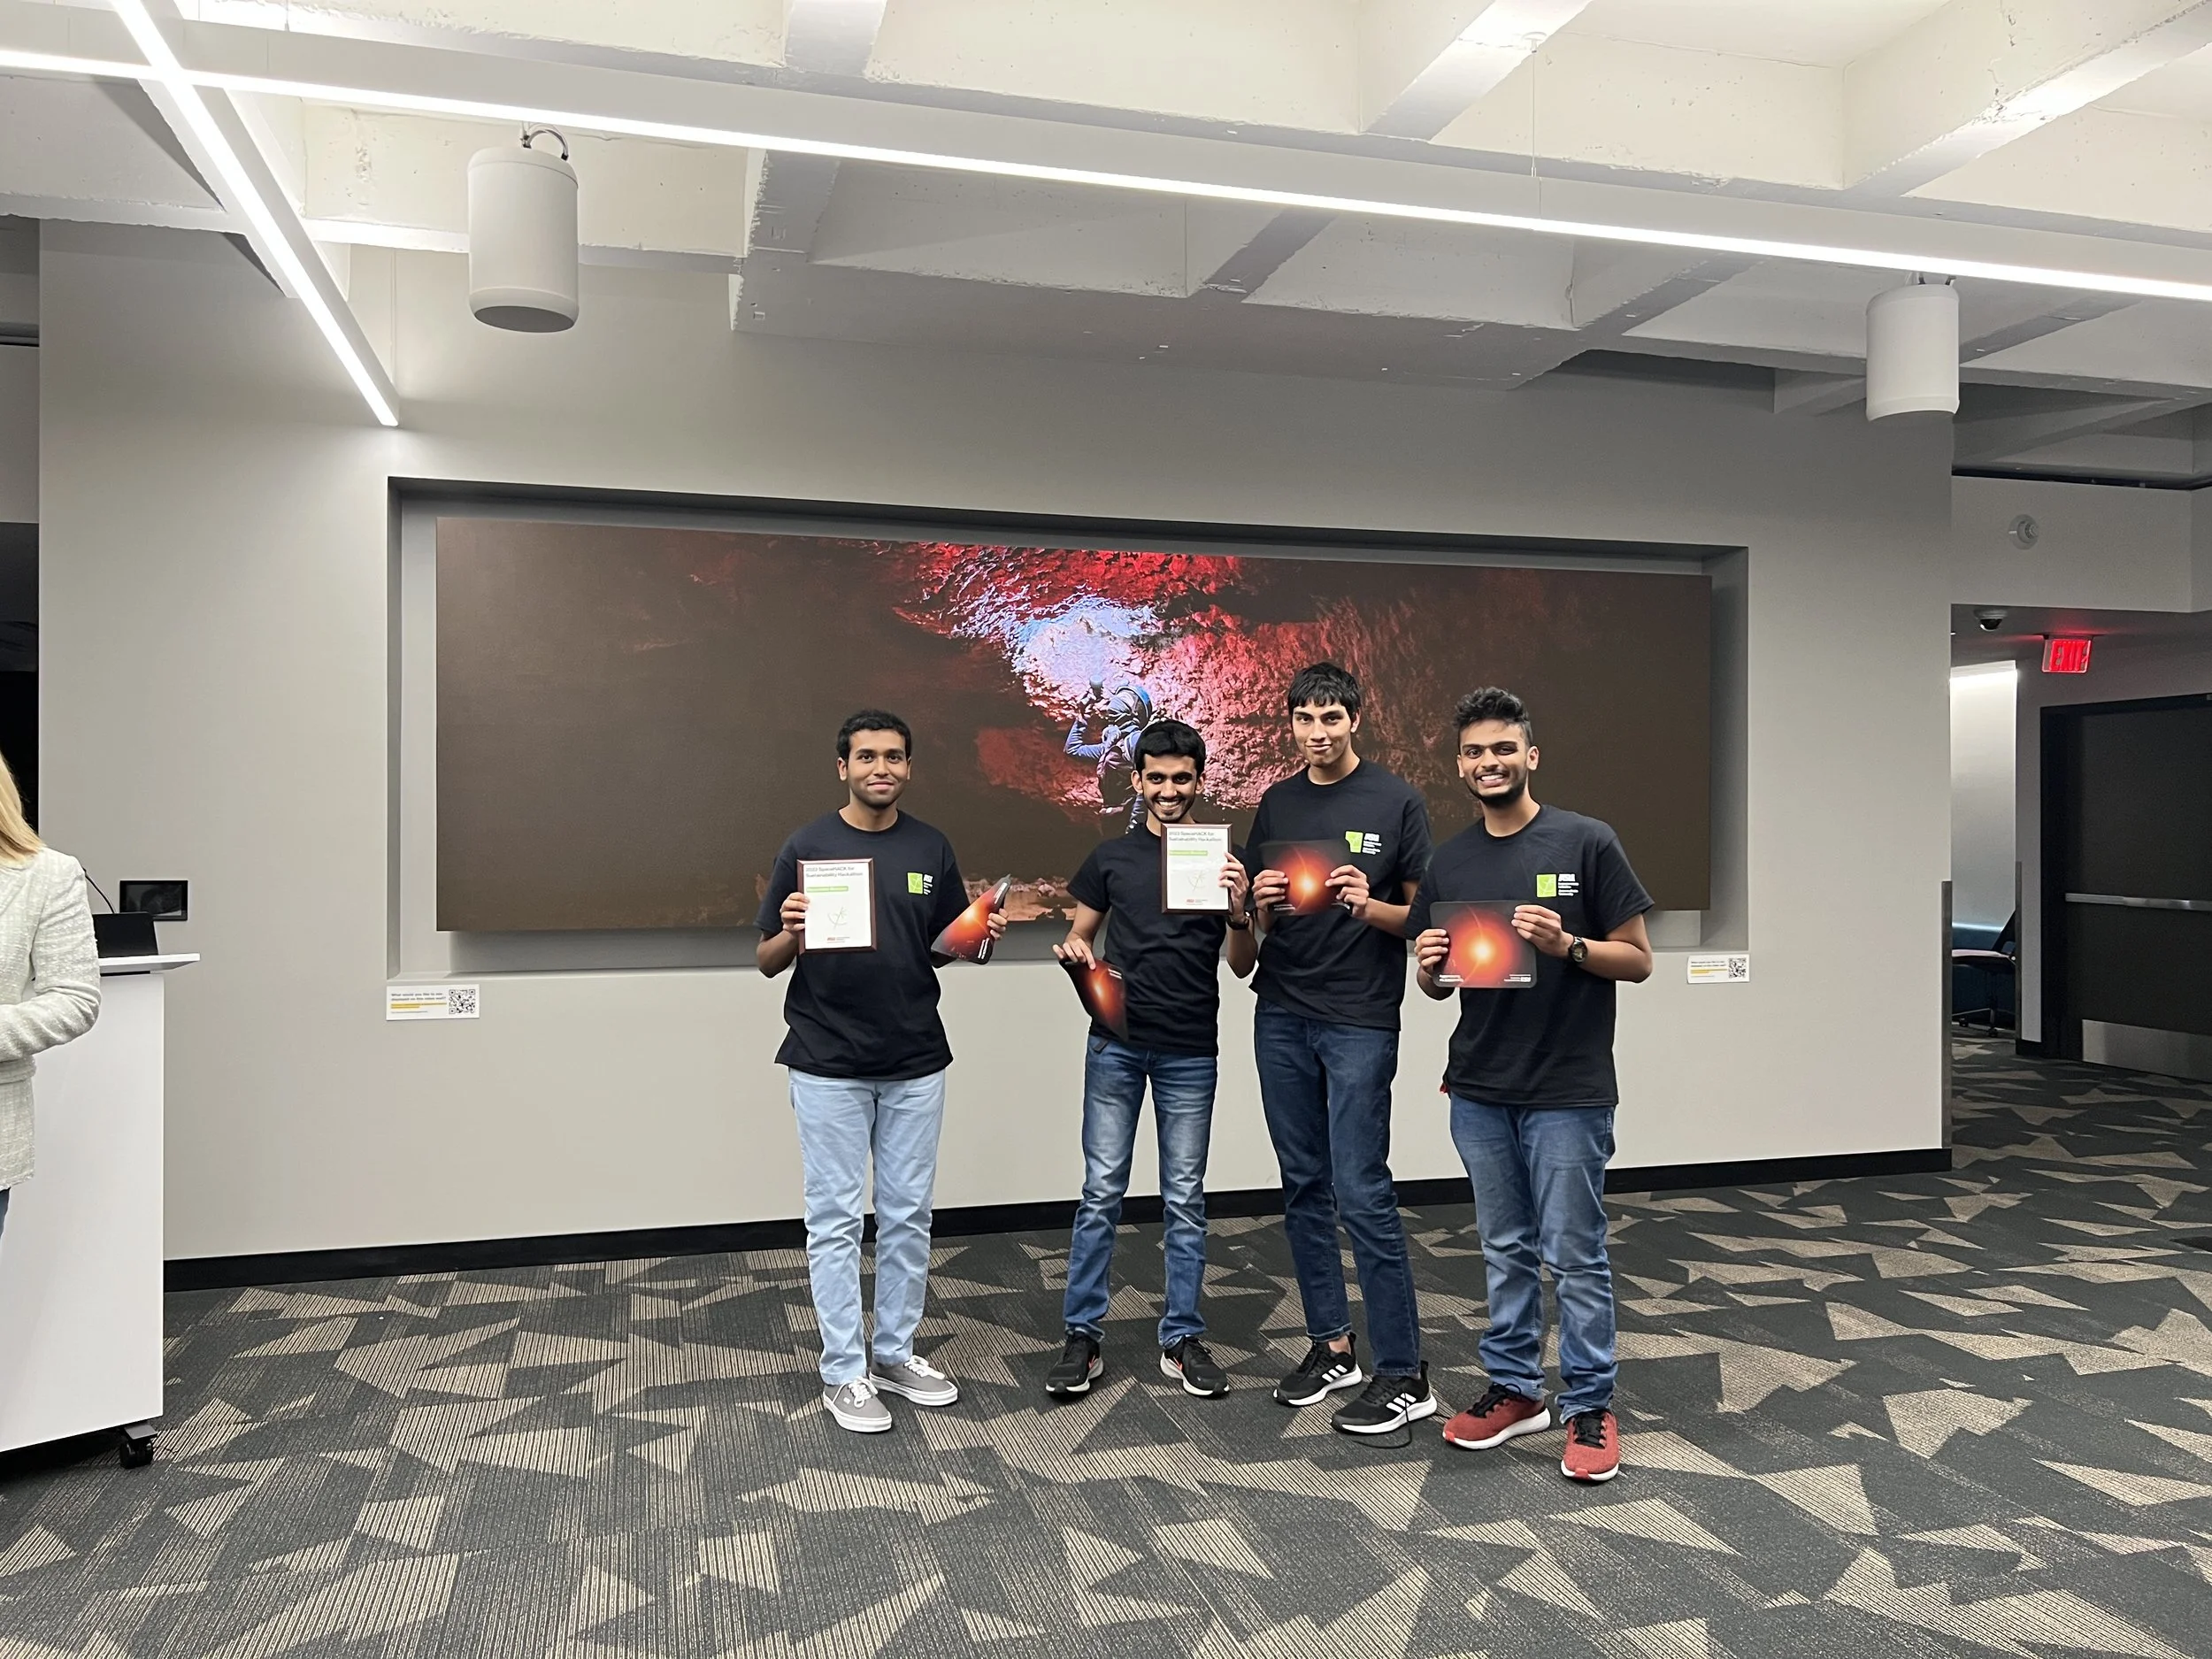
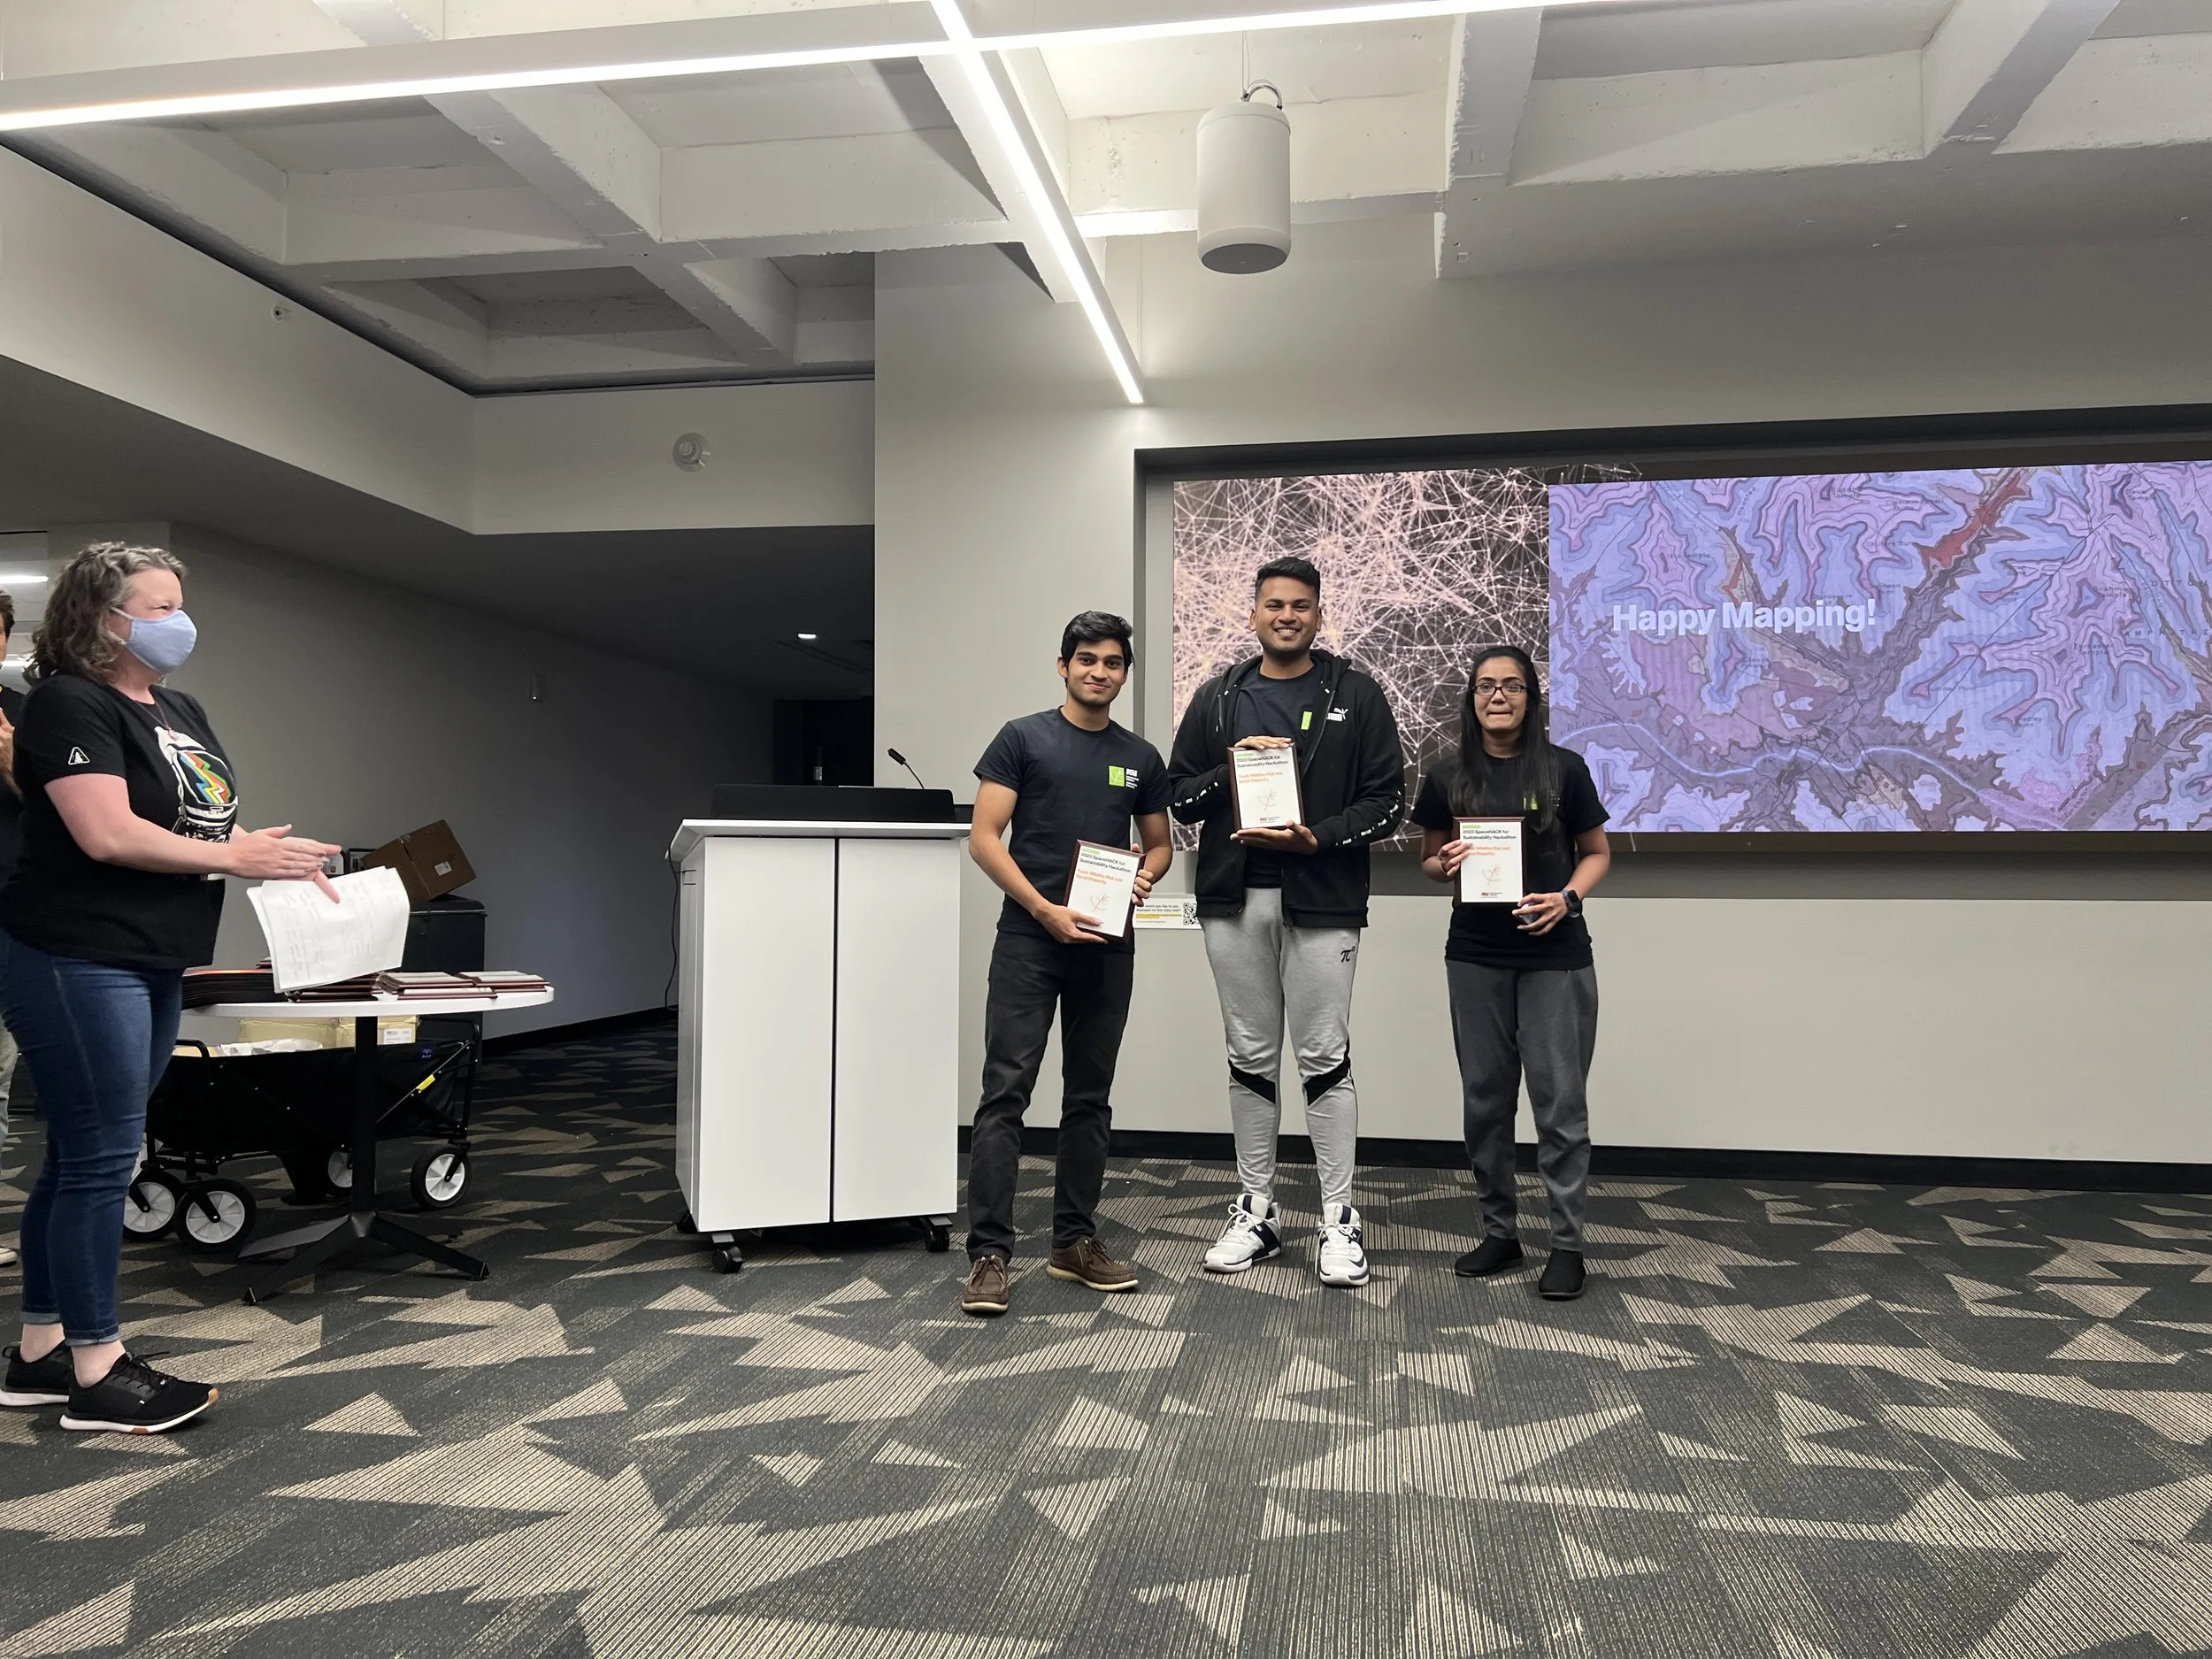
Track 3
Manthan Satish - Masters, Robotics | Aditya Mohan - Masters, Computer Science | Mirali Purohit - Ph.D., Computer Science
Focusing on California specifically, this team created a predictive model for assessing fire risk from wideband satellite data through a machine learning algorithm, which was trained using tree canopy height and vegetation dryness (factors for wildfires) and median income and median housing price (economic indicators). Certain infrared bands of satellite data were found to be correlated with fire risk. And lower median income demographic tends to have higher fire Risk Impact Factor (RIF) scores. This model could be applied to other regions throughout the world, for wildfire prediction.
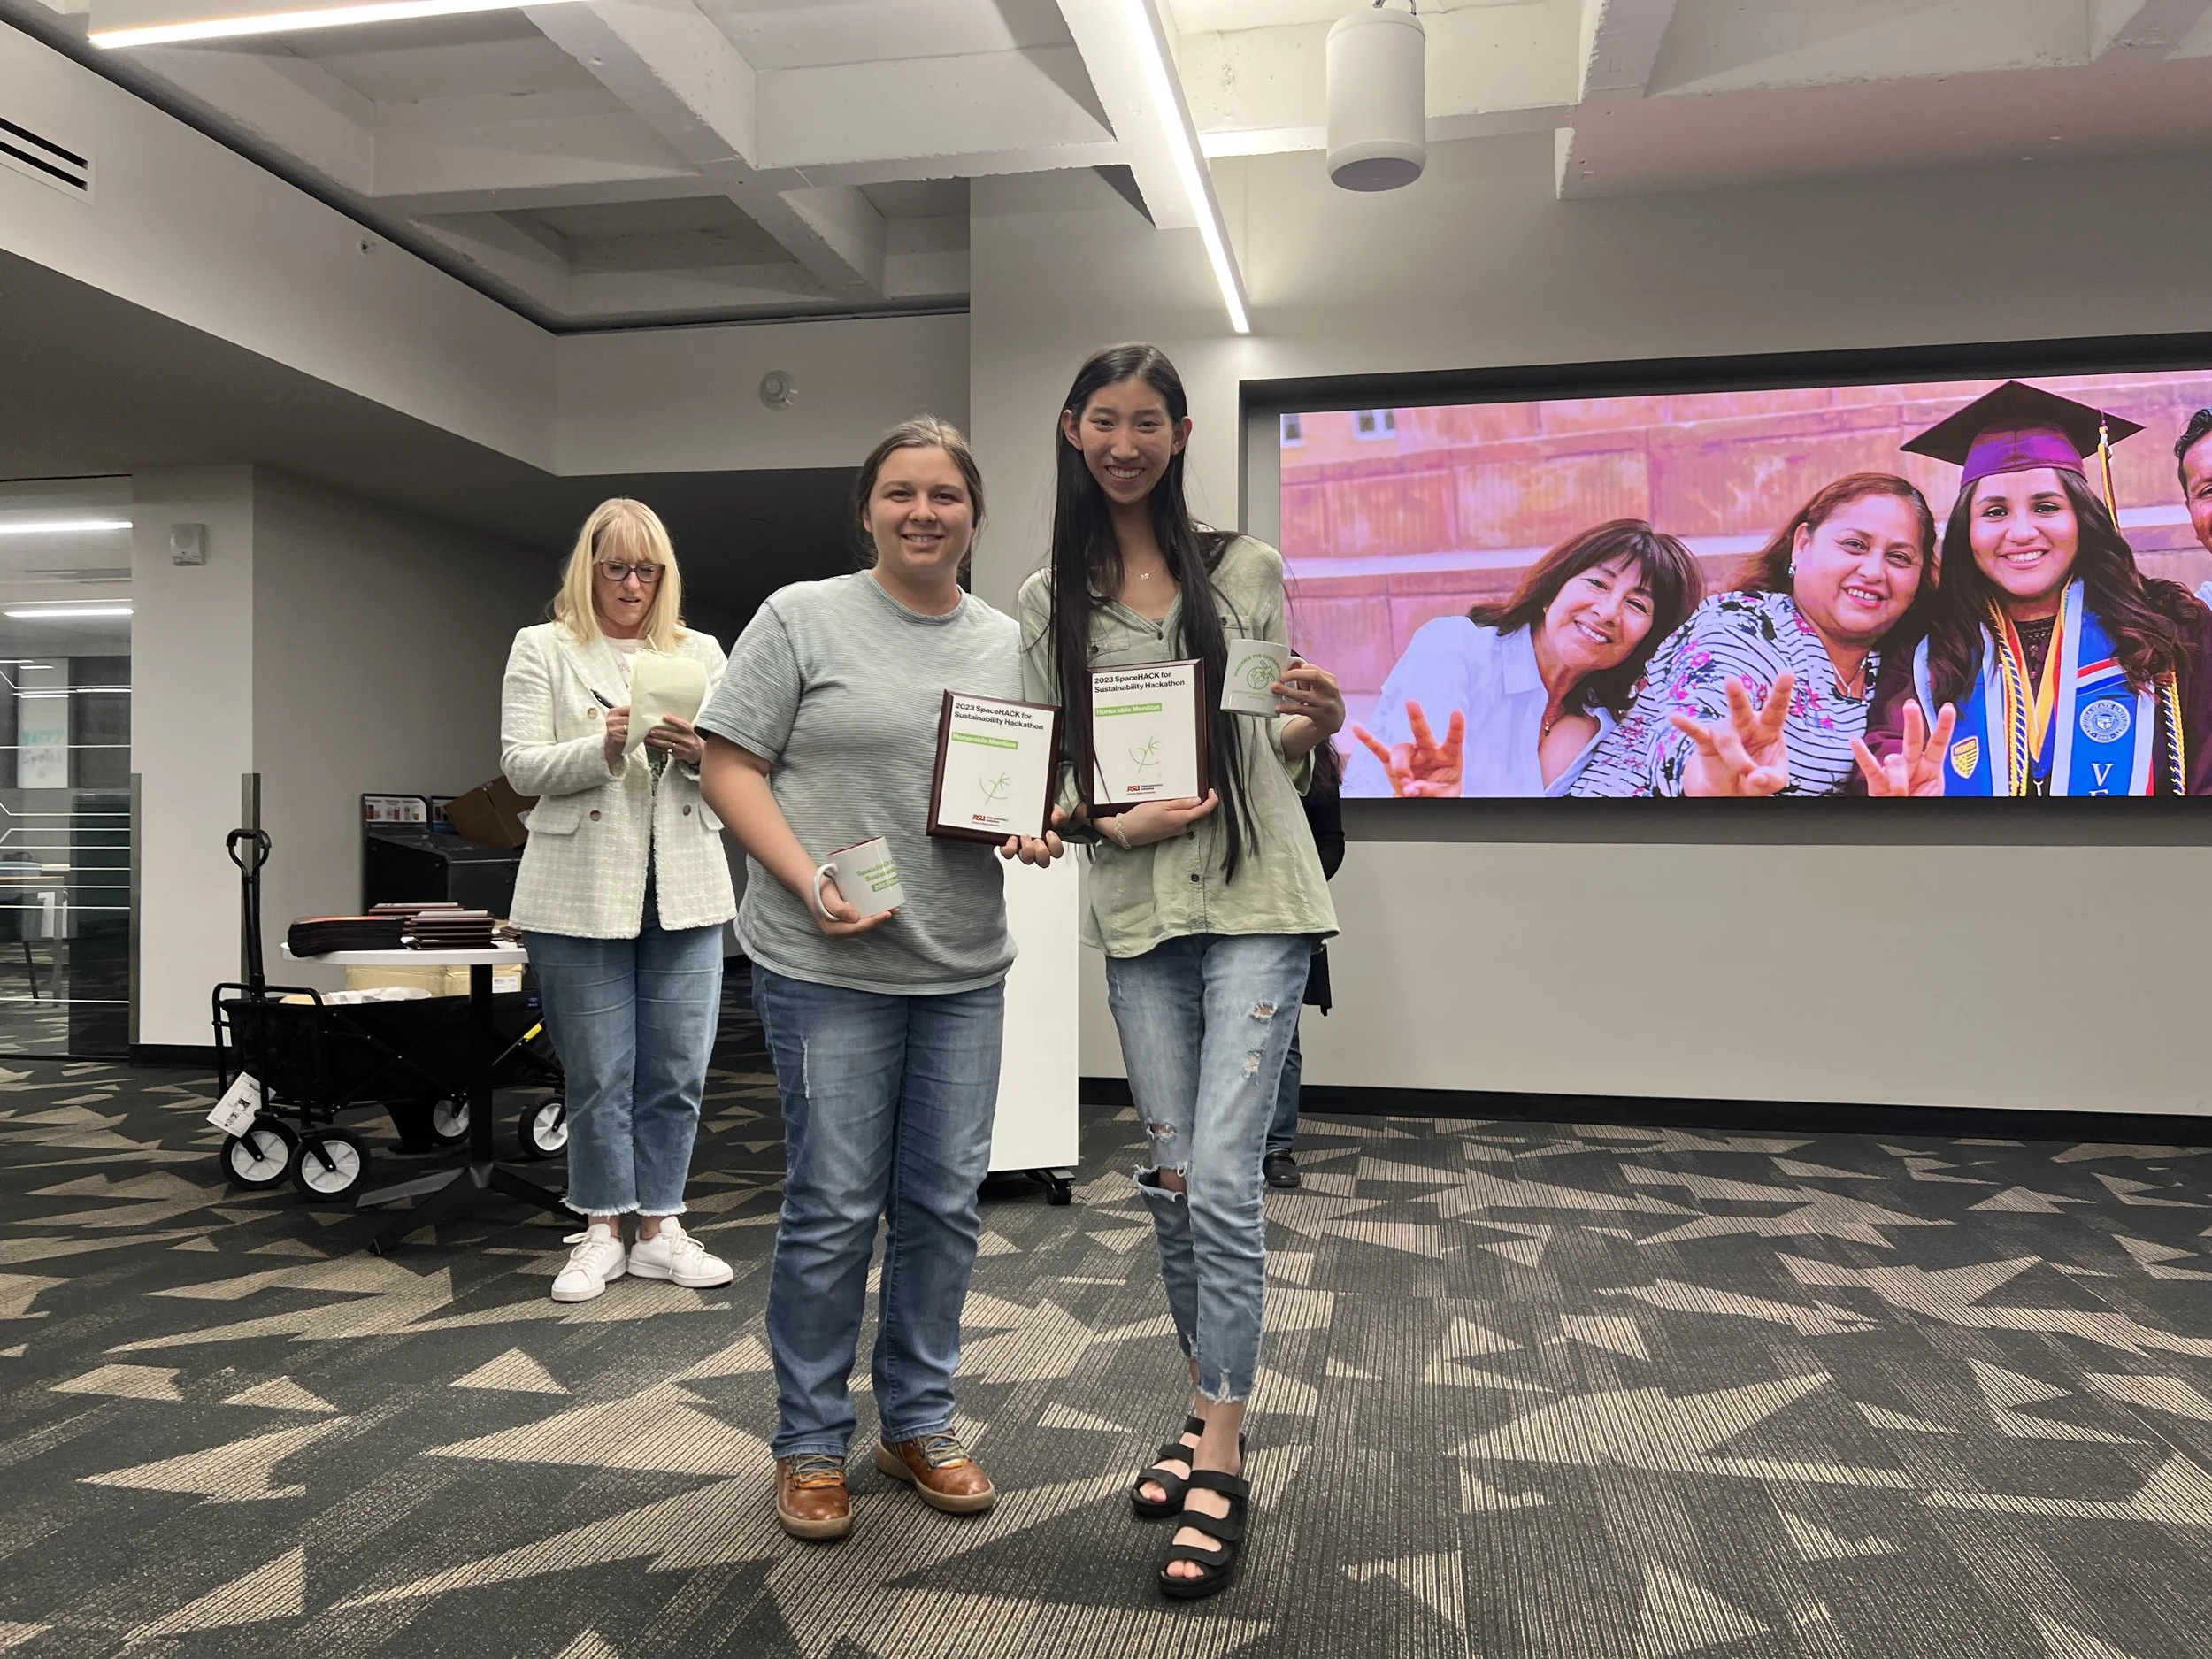
Ayush Shejwal - Freshman, Computer Science | Diya Sankla - Freshman, Data Science | Palak Jain - Freshman, Computer Science | Apoorv Singh - Freshman, Computer Science
This team compared satellite imagery of burn area, building structures, and economic data from five major global fires. They found that people residing in regions with high wildfire risk have significantly lower incomes than the national average, but for every 10% increase in the amount of "green infrastructure" in a Wildfire Urban Interface zone, the odds of a home being destroyed decreased by 8.6%. They proposed a UN initiative to build increased resilience for people around the world, who currently reside in these high risk regions.
Photo Gallery
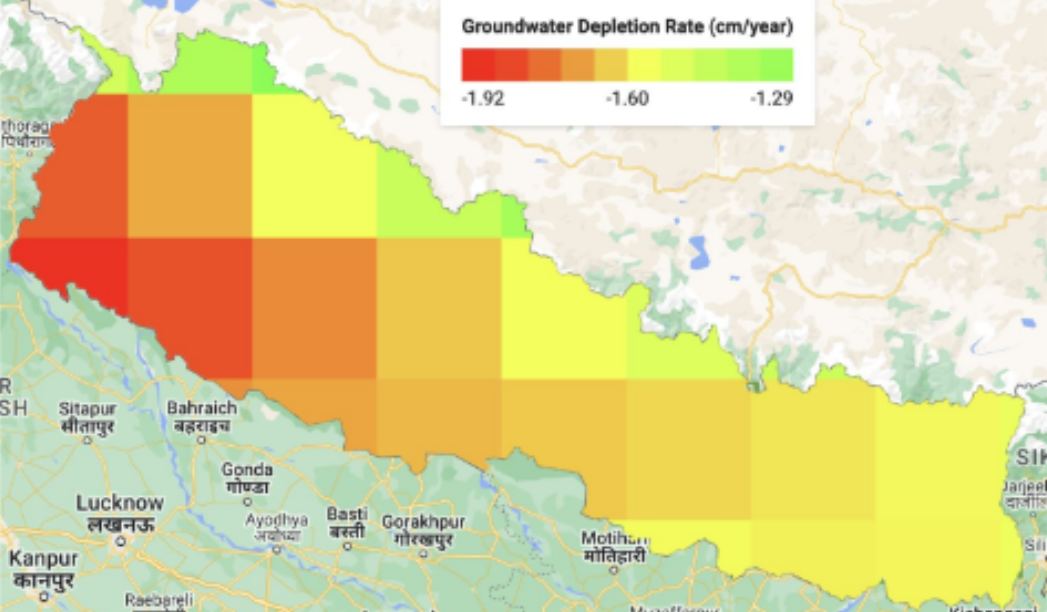
This map of Nepal shows the rate of groundwater depletion, which is most severe in western Nepal.
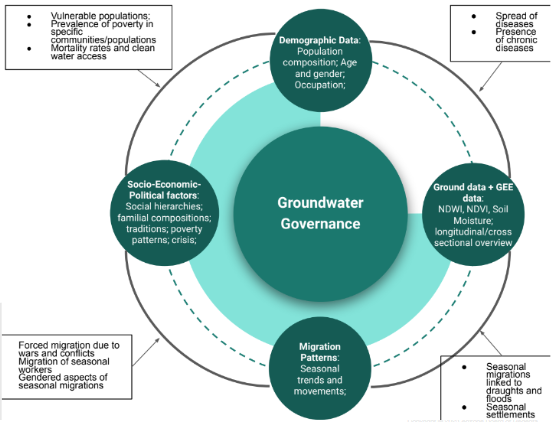
This framework shows how satellite data can inform policy, but must be complemented by socio-economic-political context.
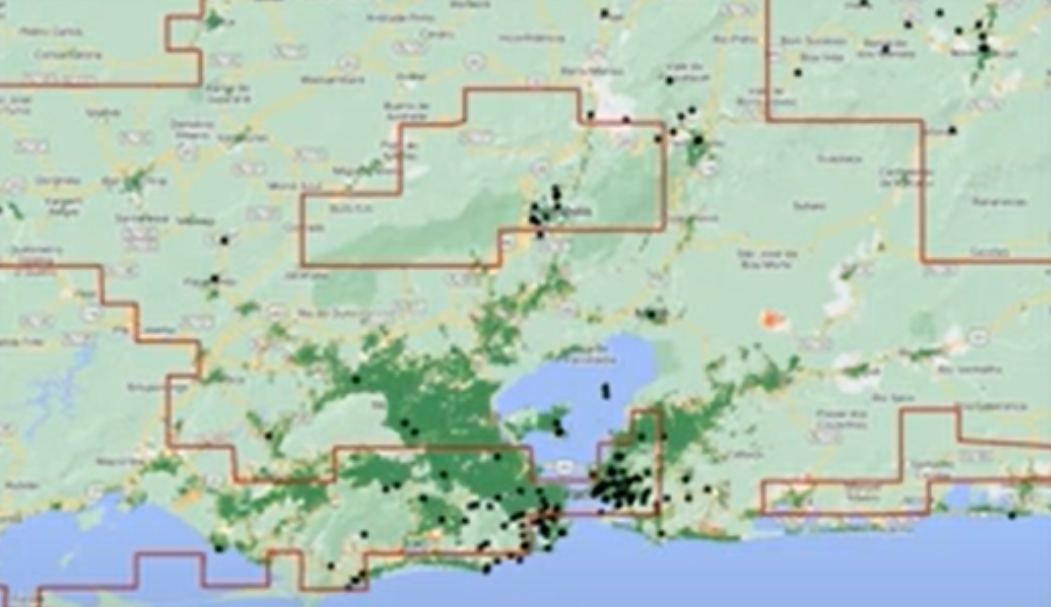
This map of Rio de Janeiro shows high-risk areas (red outline) and high population density (dark green). Black dots indicate landslides up to 2019.
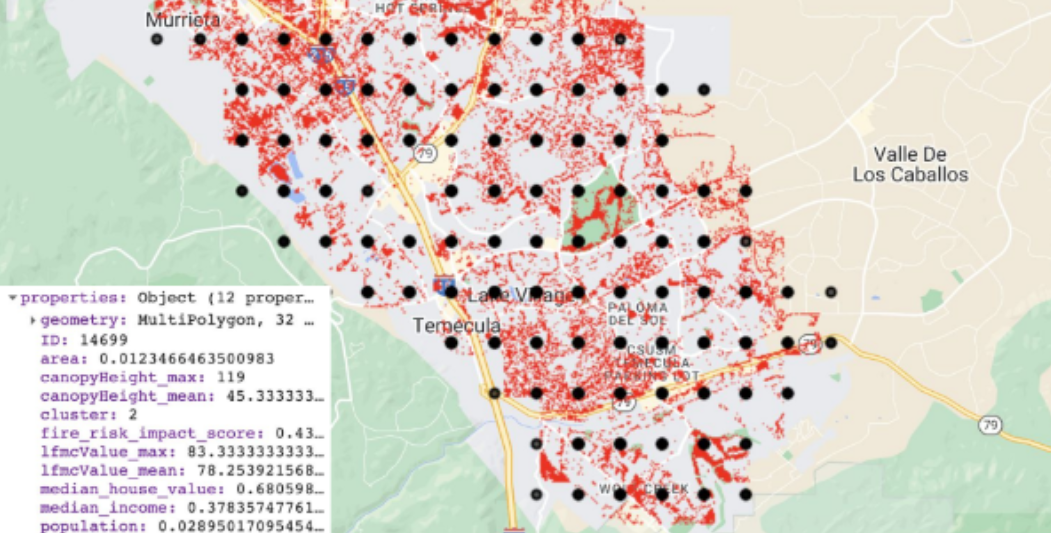
This map shows the Fire Risk Impact Factor (RIF) score of a community south of Los Angeles.
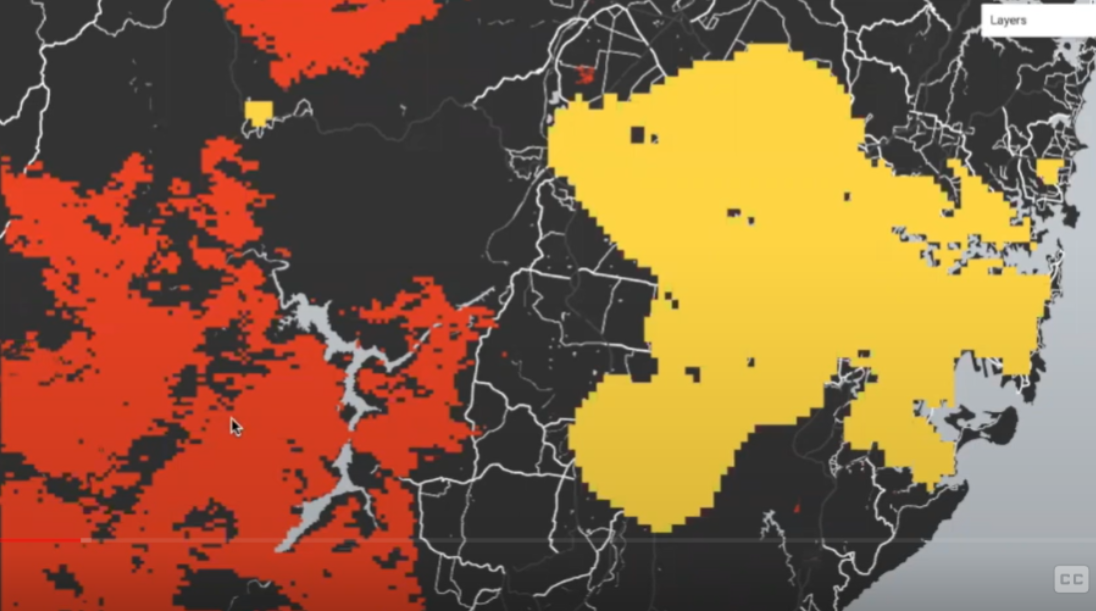
This map of Sydney shows burn areas (red) contrasted against high income areas (yellow). Globally, lower income residents of wildfire-at-risk areas are ill-equipped to migrate to high-cost urban areas during wildfires.